High Sensitivity & Dynamic Range
- High sensitivity UV-SWIR
- Large pixel well depths
- High resolution matrix
 Part of the Oxford Instruments Group
Spectroscopy-based diagnostics in the fields of Material Science, Chemistry, Life Science or Fundamental Physics & Optics rely on the capture and analysis of optical and chemical signatures with a high degree of precision.
Andor portfolio of CCD, EMCCD, InGaAs, ICCD and sCMOS cameras offer tailored solutions to particular sample or optical phenomena detection and characterisation challenges for Raman, Luminescence/Photoluminescence, Non-Linear or Optical Emission Spectroscopy/LIBS –based experiments.
Request Pricing Ask a QuestionAndor’s range of detectors offer a wide range of sensitivity, time-resolution and sensor formats to best suit specific experimental conditions from UV to SWIR, nanosecond to hours time resolution, high photon flux to single photon with super dynamic range and resolution. If you are an integrator/OEM please click here.
Experimental requirements defined by sensitivity/photon flux, wavelength range, acquisition rates, time resolution, spectral and spatial resolution will drive the choice of particular sensor technology over an other. CCD, EMCCD, InGaAs, ICCDs or sCMOS each feature unique attributes. Learn more about each technology here.
Select from the options below to find the detector platform(s) that best meet(s) your needs.
| iDus CCD | Newton CCD | Newton EM | iDus InGaAs-1.7 | iDus InGaAs-2.2 | |
| Best suited for | • Low UV-NIR photon flux • Large dynamic range |
• Low UV-NIR photon flux • Fast spectral rates • Multi-fibre acquisition |
• Very low VIS photon flux • Fast spectral rates • Multi-fibre acquisition |
• Low photon flux & high dynamic range in 1-1.7 µm spectral range | • Low photon flux & high dynamic range in 1.7-2.2 µm spectral range |
| Matrix size (pixels) | 1024 x 128 1024 x 256 2000 x 256 |
1024 x 256 2048 x 512 |
1600 x 200 1600 x 400 |
512 x 1 1024 x 1 |
512 x 1 1024 x 1 |
| Pixel size (µm) | 26 or 15 | 26 or 13.5 | 16 | 25 or 50 | 25 or 50 |
| Peak QE | 95% (VIS or NIR) | 95% (VIS or NIR) | 95% (VIS) | 85% (@1.3µm) | 70% (@1.8µm) |
| Min. Cooling (°C) | -100 (with UltraVac™) | -100 (with UltraVac™) | -100 (with UltraVac™) | -90 (with UltraVac™) | -90 (with UltraVac™) |
| Min. dark current (e-/pix/s) | 0.0004 | 0.0001 | 0.00007 | 10,700 | 5,000,000 |
| Min. read noise (e-) | 3 | 2.5 | <1 (with EM gain) | 580 | 580 |
| Max. register well depth (e-) | 1,000,000 | 1,000,000 | 1,300,000 | 170,000,000 | 170,000,000 |
| Max. spectral rate (sps) | 88 | 1,612 | 1,515 | 193 | 193 |
| Low NIR etaloning option | Yes (*) | Yes (*) | No | n/a | n/a |
| Learn more | Specifications | Specifications | Specifications | Specifications | Specifications |
| Contact us | Request Pricing | Request Pricing | Request Pricing | Request Pricing | Request Pricing |
(*) Front-illuminated versions have “zero” etaloning, back-illuminated versions with anti-fringing have “low” level of etaloning
| iStar Intensified CCD | iStar Intensified sCMOS | |
| Best suited for | • Broadband, ns-µs gated spectra • High dynamic range [low spectral rates] • Multi-fibre acquisition |
• Narrowband, ns-µs gated spectra • Fastest spectral rates • High dynamic range [high spectral rates] • Fast multi-fibre acquisition |
| Matrix size (pixels) | 1024 x 256 2048 x 512 |
2560 x 2160 |
| Pixel size (µm) | 26 and 13.5 | 6.5 |
| Peak QE | 25% (Gen 2) 48% (Gen 3) |
|
| Min. gating speed | < 2 ns | |
| Min. read noise (e-) | <1 (with MCP gain) | |
| Max. spectral rate (sps) | 3,571 | 4,008 |
| Min. Cooling (°C) | -40 | 0 |
| Min. dark current (e-/pix/s) | 0.1 | 0.18 |
| Max. register well depth (e-) | 1,000,000 | 30,000 (pixel) |
| Learn more | Specifications | Specifications |
| Contact us | Request Pricing | Request Pricing |
| Newton CCD | Newton EMCCD | iXon EMCCD | ZL41 Wave sCMOS | Marana sCMOS | |
| Best suited for | • Low UV-NIR photon flux • Fast spectral rates and fast kinetics mode (µs resolution) • Broadband spectra |
• Very low VIS photon flux • Fast spectral rates and fast kinetics mode (µs resolution) • Broadband spectra |
• Very low VIS photon flux • Faster spectral rates and fast kinetics mode (µs resolution) • Narrowband spectra |
• Low VIS-NIR photon flux • Fastest spectral rates • Narrowband spectra |
• Low UV-VIS photon flux • Fastest spectral rates • Narrowband / Broadband spectra |
| Matrix size (pixels) | 1024 x 256 2048 x 512 |
1600 x 200 1600 x 400 |
512 x 512 1024 x 1024 |
2560 x 2160 2048 x 2048 |
2048 x 2048 |
| Pixel size (µm) | 26 or 13.5 | 16 | 13 or 16 | 6.5 | 6.5 or 11 |
| Peak QE | 95% (VIS or NIR) | 95% (VIS) | 95% (VIS) | 60% or 82% | 95% (VIS) |
| Min. Cooling (°C) | -100 (with UltraVac™) | -100 (with UltraVac™) | -100 (with UltraVac™) | -10 | -45 (with UltraVac™) |
| Min. dark current (e-/pix/s) | 0.0001 | 0.00007 | 0.00011 | 0.019 | 0.1 |
| Min. read noise (e-) | 2.5 | <1 (with EM gain) | <1 (with EM gain) | 0.9 | 1.2 |
| Max. register well depth (e-) | 1,000,000 | 1,300,000 | 800,000 | 30,000 (pixel) | 85,000 (pixel) |
| Max. spectral rate (sps) | 1,612 | 1,515 | 11,074 | 27,057 | 24,367 |
| Low NIR etaloning option | Yes (*) | No | No | Yes (*) | No |
| Learn more | Specifications | Specifications | Specifications | Specifications | Specifications |
| Contact us | Request Pricing | Request Pricing | Request Pricing | Request Pricing | Request Pricing |
(*) Front-illuminated versions have “zero” etaloning, back-illuminated versions with anti-fringing have “low” level of etaloning
| iKon-M | iXon EMCCD | ZL41 Wave sCMOS | Marana sCMOS | iStar 334T | iStar sCMOS | |
| Best suited for | • Low UV-NIR photon flux • Fast spectral rates and fast kinetics mode (µs resolution) • Broadband spectra |
• Very low VIS photon flux • Fast spectral rates and fast kinetics mode (µs resolution) • Broadband spectra |
• Very low VIS photon flux • Faster spectral rates and fast kinetics mode (µs resolution) • Narrowband spectra |
• Low UV-VIS photon flux • Fastest spectral rates • Narrowband / Broadband spectra |
• Low UV-VIS photon flux • Fastest spectral rates • Narrowband / Broadband spectra |
• Low UV-VIS photon flux • Fastest spectral rates • Narrowband / Broadband spectra |
| Matrix size (pixels) | 1024 x 1024 | 512 x 512 1024 x 1024 |
2560 x 2160 2048 x 2048 |
2048 x 2048 | 1024 x 1024 | 2560 x 2160 |
| Pixel size (µm) | 13 | 13 or 16 | 6.5 | 6.5 or 11 | 13 | 6.5 |
| Peak QE | 95% (VIS or NIR) | 95% (VIS) | 60% or 82% | 95% (VIS) | 25% (Gen 2) 48% (Gen 3) |
|
| Min. Cooling (°C) | -100 | -100 | -10 | -45 | -40 | 0 |
| Min. dark current (e-/pix/s) | 0.00012 | 0.00011 | 0.019 | 0.1 | 0.04 | 0.18 |
| Min. read noise (e-) | 2.9 | <1 (with EM gain) | 0.9 | 1.2 | <1 (with MCP gain) | |
| Max. register well depth (e-) | 150,000 | 800,000 | 30,000 (pixel) | 85,000 (pixel) | 1,000,000 | 30,000 (pixel) |
| Max. full image rate (fps) | 4.4 | 26 or 56 | 100 | 74 | 4.2 | 50 |
| Shuttering Mechanism | Mechanical Shutter | Frame Transfer | Electronic Shutter | Electronic Shutter | Image Intensifier < 2 ns | |
| Low NIR etaloning option | Yes (*) | No | Yes (*) | No | n/a | n/a |
| Learn more | Specifications | Specifications | Specifications | Specifications | Specifications | Specifications |
| Contact us | Get Pricing | Get Pricing | Get Pricing | Get Pricing | Get Pricing | Get Pricing |
(*) Front-illuminated versions have “zero” etaloning, back-illuminated versions with anti-fringing have “low” level of etaloning
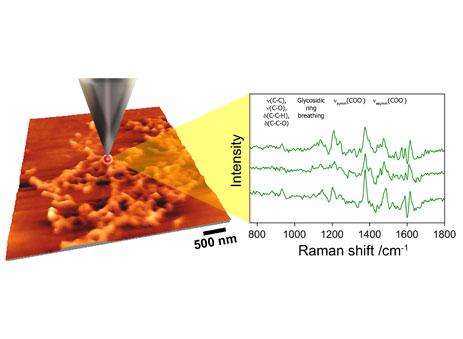
Raman is a molecular spectroscopy technique that can provides chemical and structural fingerprint information for a wide range of samples, including for example nanomaterials, polymers, powders, liquids or cells/tissues. Key Raman techniques include:
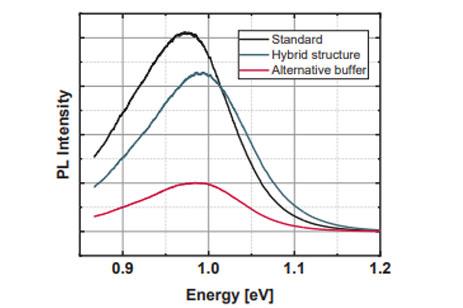
Luminescence spectroscopy is used for a large variety of applications including for example the study of metal complexes, organic LEDs (OLEDs), quantum dots, cell dynamics, stand-off detection of chemical compounds (e.g. explosives) or scintillators properties measurement. Key techniques include:
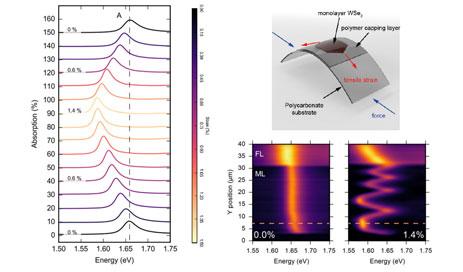
Ultraviolet Visible Near-Infra red (UV-Vis-NIR) spectroscopy is useful to characterise the absorption, transmission, and reflectivity of a variety of materials such as pigments, biological, coatings, windows, filters, or analyse the dynamics of chemical reactions. Variations of these spectroscopy techniques include:
Optical Emission Spectroscopy (OES) is a fundamental, non-invasive diagnostic technique for a wide range of plasma, and can provide information such as composition and species temperature and energy distribution.
Laser-induced breakdown spectroscopy (LIBS) is used to determine the elemental composition of various solids, liquids and gases. A high power laser pulse is focused on to a sample to create a plasma. Emission from the atoms and ions in the plasma is collected and analysed by a spectrograph and gated detector to determine the elemental composition or the elemental concentrations in the sample.
Contact our application specialists Browse application resources
Micro-spectroscopy covers a very wide range of spectroscopy modalities with the common character that the spectroscopic measurement is made on the microscopic scale. Andor spectroscopy systems are routinely used for Raman-based techniques including:
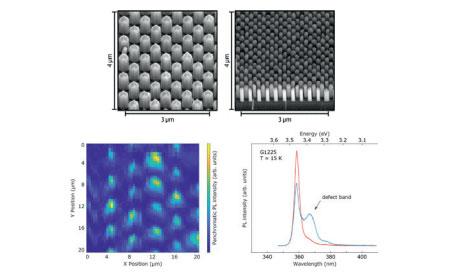
Non-linear (NL) spectroscopy encompasses a number of optical techniques that can be used to study for example interfacial and surface processes, ultrafast dynamic processes (pump-probe technique), light transport or assist in the understanding of nanoparticles/nanostructures unique optical properties. Key techniques include:
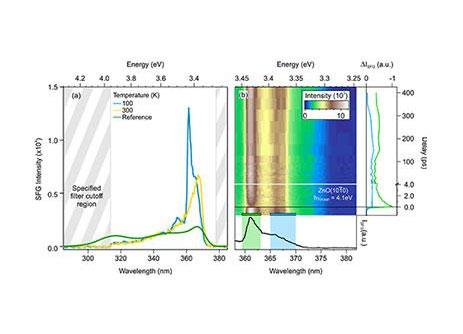
Optical spectroscopy can provide analytical information on materials from the micro to the nano-scale, through a number of techniques with a large range of sensitivity, resolution and flexibility requirements. Examples include:
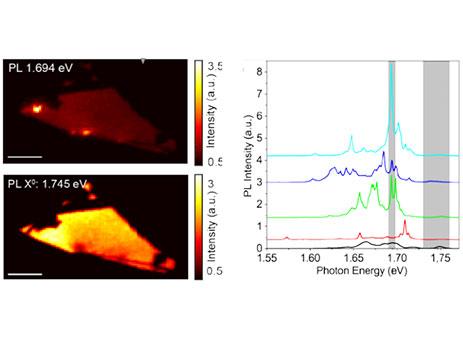
Optical spectroscopy can be used to non-invasively study the changes in the composition of chemical(s) or material(s).
Chemical reaction products or transient behaviours can be probed by Andor Spectroscopy systems through a variety of techniques based on Raman, transient absorption / pump-probe or fluorescence.
Contact our application specialists Browse application resources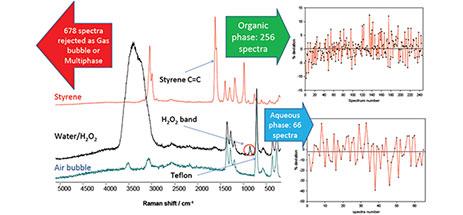
Optical spectroscopy can provide very specific analytical information in a non-invasive matter for a range of bio-samples, often as a complement to microscopy imaging (micro-spectroscopy) or visual inspection.
Field of applications include for example cancer cell in vivo and ex vivo screening and cancer diagnostics, non-invasive monitoring of patient bio-parameters or cell sorting.
Contact our application specialists Browse application resources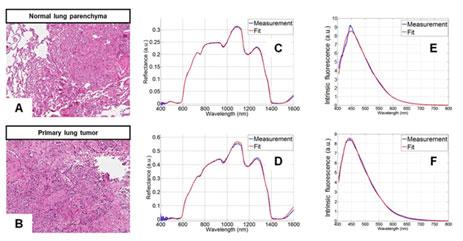
Plasmas can be artificially produced by different means (e.g. laser ablation, coupling of capacitive / inductive power source to ionised gas). The understanding of their properties and dynamics is relevant to a number fields such as fusion, thin films deposition, micro-electronics, material characterization, display systems, surface treatment, fundamental physics, environmental & health.
Gated detectors can be used to determine optical parameters from which fundamental plasma properties can be derived. Accurate nanosecond-scale gating of image intensifier-based detectors can be used to sample plasma dynamics, or to isolate the useful plasma information generated by pulsed lasers.
Contact our application specialists Browse application resources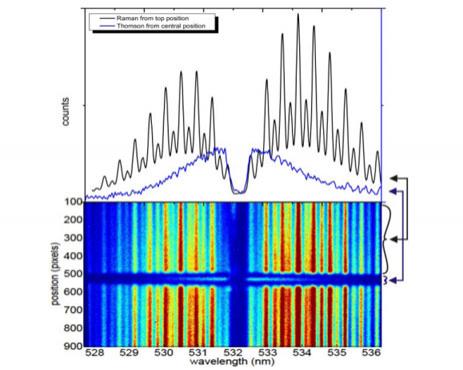
Complete your spectroscopy system with Andor’s range of modular spectrograph portfolio, or tailor your camera to best suit your specific application.
Andor’s range of tools for spectroscopy are designed to assist Researchers with identifying the detection configuration(s) that best matches a given spectroscopy setup requirements from the detector (signal-to-noise ratio comparator) to the spectrograph (spectral resolution and bandpass calculator).

 Powered by Bioz