Resources
 Part of the Oxford Instruments Group
Expand
Collapse
 Part of the Oxford Instruments Group
Biphasic reactions offer tremendous opportunities in industrial chemical syntheses due to the ease at which the phases and hence reagents can be separated, thereby avoiding energy-intensive separation processes such as distillations [1]. A contemporary challenge presented in the implementation of biphasic reaction conditions is to determine and control the chemistry occurring in each phase, in order to improve manufacturing processes. Inline HPLC techniques for monitoring biphasic reaction have already been developed and demonstrate the potential benefits of inline monitoring in controlling and optimizing reactions [2, 3].
In this article, the development of a fully automated system for monitoring changes in the composition of two immiscible phases by Raman spectroscopy using a flow sampling system is presented. This Raman/Flow system can acquire and distinguish Raman spectra of the phases present in an emulsified reaction mixture and offers a key advantage in the real-time information it can deliver. It takes advantage of the new generation of low dark current deep-depletion (LDC-DD) CCD technology to enable acquisition of the ‘pure’ species spectrum.
This also demonstrates the extended spectral coverage (increase of ca. 200 cm-1) that is acquired with no loss in spectral resolution, due to the extended width of this new sensor type. The final goal is to obtain reliable real-time kinetic data for two-phase reaction mixtures in which substrates in the organic phase undergo oxidation.
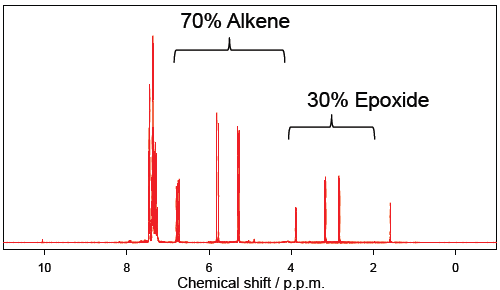
The model reaction chosen for this study is the oxidation of styrene with a dinuclear manganese catalyst (Figure 1). Under biphasic conditions (styrene/water) 30% conversion to the epoxide was observed after 14 h (Figure 2) as determined by phase separation and 1H NMR analysis of the organic phase.

Figure 1: Oxidation of styrene in aqueous carbonate with H2O2 catalysed by a manganese catalyst.
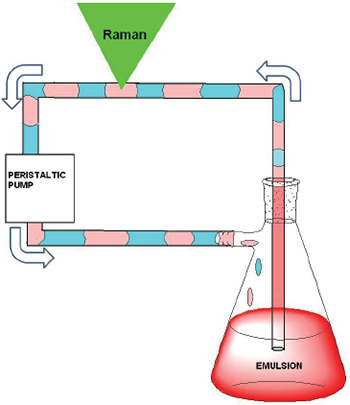
The biphasic mixture is emulsified in the reactor and a peristaltic pump connected with chemically resistant tubing (PTFE) samples the mixture continuously. Upon entering the PTFE tube, the emulsion breaks and a two phase (organic and aqueous) flow (slug flow, 10 mL/s) is obtained. The slug flow allows very short periods in which only either an aqueous, organic or air pocket is present within the confocal volume of the Raman probe.

Figure 2: 1H NMR spectrum of the organic phase (in CDCl3) after 14 h.
The sample withdrawn must be returned to the reaction vessel with a minimum of delay and hence the flow rate and time available to record a spectrum of individual slugs is limited – this requires rapid, high sensitivity, detection.

Figure 3: Schematic of the flow system / Raman sampling setup is shown above.
Visible absorption by a catalyst in the aqueous phase limits collection of Raman scattering due to reabsorption. Initially 785 nm is optimum; however, over the course of the reaction the absorbance decreases and hence to maximise for spectral range 532 nm was used also (Figure 3).
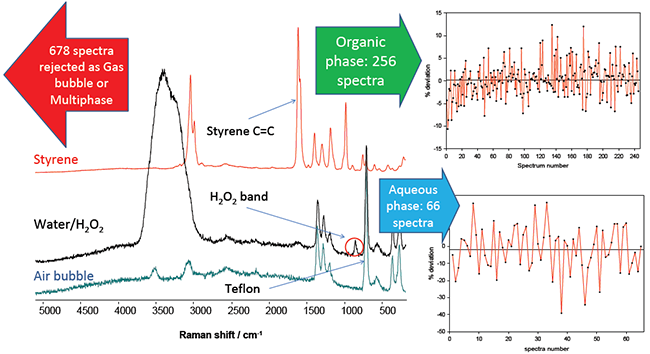
The experimental setup used is comprised of an iDus CCD Low Dark Current Deep-Depletion detector and Shamrock 163 spectrograph (Andor Technology), a 532 nm fibre coupled laser (200 mW at sample, Cobolt lasers) and Raman probe (Avantes). 1000 Raman spectra were acquired in 60 s using 30 ms exposure time per acquisition, as shown in Figure 4 after discrimination.
Based on their chemical fingerprint features, the spectra obtained could be discriminated into four groups: organic and aqueous phase, aqueous phase only, organic phase only or gas bubbles. The spectra are sorted using a simple algorithm and spectra of solely organic and solely aqueous phases are retained.
The spectra showing only the organic and aqueous phase were extracted and, after normalization using the Raman bands of the PTFE tubing, the deviation (in percentage) of selected bands of the styrene (C=C stretch) and H2O2 (O-O stretch) in each spectrum was plotted. For both the graphs the median (black line) and the mean value are within 2%.
Taking this approach the very large difference in absolute Raman intensity between the strongly scattering styrene and weakly scattering H2O2 is not a factor in the analysis and hence high S/N spectra can be acquired from each phase every 60 s.

Figure 4: Spectrum of the organic (styrene) phase (red), of the aqueous phase (black) and where a bubble of air occupied the focal volume of the probe. These spectra were extracted from the 1000 spectra obtained.
The advantages and technical challenges facing the application of non-invasive Raman scattering in real-time reaction monitoring in biphasic solutions is demonstrated and a solution to the large intensity differences between components of interest is shown to be feasible.
Davide Angelone,a Shaghayegh Abdolahzadeh,a Antoine Varagnat,c Andrew C. Dennis,c Johannes W. de Boer, b Wesley R. Browne,
a Centre for Systems Chemistry, Stratingh Institute for Chemistry, University of Groningen, Nijenborgh 4, 9747 AG Groningen, The Netherlands.
b Catexel BV, BioPartner Center Leiden, Wassenaarseweg 72, 2333 AL Leiden, The Netherlands.
c Andor Technology - 7 Millennium Way, Springvale Business Park, Belfast, BT12 7AL, United Kingdom.
Date: October 2013
Author: Davide Angelone et al, Centre for Systems Chemistry, Stratingh Institute for Chemistry, University of Groningen
Category: Application Note
