
iStar 334T CCD
View Product
 Part of the Oxford Instruments Group
Direct, non-intrusive, measurements of electric fields are essential for understanding RF-sheath physics. This is especially true in the case of the ICRF antenna-plasma edge interaction in fusion devices. The rectification of the RF-fields near the plasma-facing components of an antenna leads to the development of DC electric fields that accelerate the ions from the plasma towards the antennas’ plasma-facing components, enhancing physical sputtering and release of impurities.
IShTAR is a device dedicated to the investigation of the plasma-antenna interactions in tokamak edge-like conditions. It has a simplified geometry and enables easy access and fast modification, which makes it a suitable environment to develop diagnostics for electric field measurements. This paper presents the observed Stark effect on the He I spectral line profile with passive high resolution optical emission spectroscopy. Measured line profiles with high resolution are compared with the analytical models of the Stark effect in magnetized helium plasma that, as a result of the good fit, provide the electric field strength.
Auxiliary plasma heating by waves in the ion cyclotron frequency range (ICRF) is an important heating option in magnetic confinement fusion devices. The great advantage is the ability to directly heat the ions in the plasma core in various scenarios with high efficiency.
The current concern regarding the ICRF heating, however, is its contribution to the heavy-impurity influx originating from the ICRF antenna structure. This has been experimentally observed in various devices that employ ICRF antennas for heating. [1–3]
The underlying cause for this spurious phenomenon is not yet fully understood. It is theorized that the formation of the hot spots, erosion and increased physical sputtering from the antenna’s plasma-facing components are enhanced by the rectified potential that occurs in the RF sheath established around these areas. [4, 5] Due to this mechanism, also called the RF-sheath rectification, the ions are accelerated out of the plasma with greater velocities than defined by the Bohm sheath criterion, leading to the higher sputtering yields.
To address this issue, and either suppress or completely eliminate these harmful effects, two parallel efforts are ongoing. One approach is to change the design of the antenna itself. [6] At the same time, an active field of research is the understanding of RF-sheath physics for which several theoretical models have been proposed. The development of a numerical description is ongoing. However, the theories are still missing a quantitative experimental verification.
The main goal of our work is to develop a diagnostics method that will provide direct measurements of electric fields in the vicinity of an ICRF antenna, in a simplified geometry compared to the one found in a tokamak, yet in representative environmental plasma-edge conditions. The results presented here are the spectroscopic measurements of Stark-effect-sensitive helium lines performed on a DC-biased electrode immersed in the helicon plasma source of IShTAR.
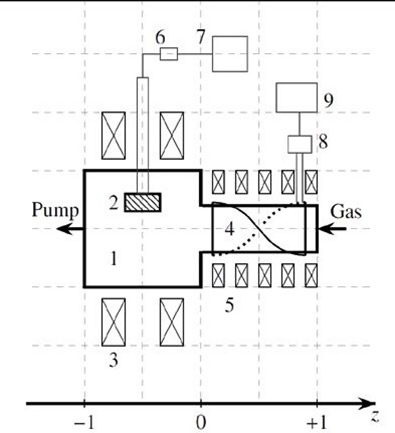
Fig. 1. Schematic view of IShTAR: 1 - Main chamber; 2 - single strap ICRF antenna; 3 - Magnetic field coils (Big coils); 4 - Helicon plasma source; 5 - Magnetic field coils (Small coils); 6 - Autotuner; 7 - ICRF generator; 8 - Matching system; 9 - RF generator.
IShTAR is a test facility dedicated to RF-sheath studies, located at the Max-Planck Institute for Plasma Physics in Garching, Germany. This device is designed to mimic the tokamak edge environment (in terms of plasma density and temperature) especially for studying ICRF antenna-plasma interactions, but with a simplified geometry required by the numerical models concentrating on this area of research.
The design characteristics, choice and range of operational and plasma parameters of IShTAR have been elaborated in the references provided. [7–9] The schematics of the machine and its main components are shown in Fig. 1. IShTAR consists of a helicon plasma source connected to a larger experimental chamber equipped with an ICRF antenna, referred to as the main chamber. Around both the plasma source and the main chamber magnetic field coils are wound in a Helmholtz-like configuration, providing a parallel magnetic field along the z-axes.
The achievable limits for various parameters are listed in Table 1.
| Parameter | Achievable Value |
| P (mbar) | 106 – 102 |
| Gas | Ar/He/H |
| BBigCoils (T) |
0.27 (10 s) or 0.4 (pulsed) |
| BSmallCoils (T) | 0.1 (10 s) or 0.1 (coils’ limit) |
| PPF-Helicon (MW) | 1 (presently 0.003) |
| fHelicon (MHz) | 2.30 |
| ICRF Antenna | 1 MW (30 MHz), AUG generator |
| 1 kW (5 or 15 MHz), IShTAR generator |
Table 1. Achievable values of the base operational parameters of the IShTAR experiment
Passive optical spectroscopy is selected as the first approach to directly measure electric fields in the vicinity of an ICRF antenna, without disturbing the plasma environment. This technique enables studying the perturbation of the electronic structure of an atom caused by an external electric field, the Stark effect. These perturbations are detectable as a shift of the central wavelength of a spectral line, and the occurrence of forbidden components of the fine structure in a spectral line profile.
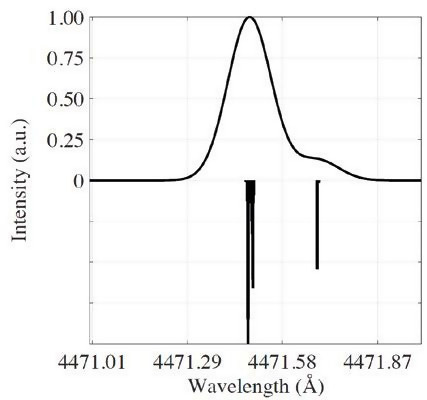
Fig. 2. Triplet He-I 43 D - 23 P line profile simulated with the EZSSS code with no external electric field (reference scenario) shows discrete and continuous results, with the main component at 4471.49 Å and the second component at 447.6 Å
We have focused our research on the Stark effect on 43 D - 23 P transitions in helium. The method requires a high resolution spectrometer with high dynamic range detector capable of resolving allowed and forbidden lines of the transition being studied. A 0.75 m spectrograph (Shamrock SR-750-B2) equipped with an ICCD camera (iStar DH334T-18U-E3) has been installed and used in the work.
In test work the He n = 4 - 23 P transition has been selected for electric field measurements, since the signal-to-noise ratio of the recorded spectra was acceptable and line Stark broadening is strongly affected by the E-field. Once the time-averaged spectra are recorded, the spectral line profiles are compared with the simulated ones and the electric field amplitude is extracted with the method of least squares.
To simulate the spectra perturbed by an electric field, in the presence of a background magnetic field, the Explicit Zeeman Stark Spectral Simulator (EZSSS) [10] was used. This code generates the discrete spectrum by solving the Schrödinger equation with electric dipole approximation, with external electric and magnetic fields as perturbations. In a second step, by convoluting the discrete spectra with Gaussian and/or Lorenzian profiles to mimic the broadening mechanisms, the continuous spectrum is obtained.
Figure 2 depicts the modelled triplet line profile corresponding to the 43 D - 23 P He-I transition with no electric field externally imposed on the system. The discrete spectra, calculated with the EZSSS code is shown as a set of lines in the mirror image of the intensity scale.
The continuous spectra, presented in the positive part of the Intensity axes is convoluted with a Gaussian distribution corresponding to the Doppler broadening with a temperature of the radiator of 0.7 eV. The distinct feature of these spectra is the occurrence of the second spectral line red-shifted from the main component, corresponding to the fine structure of the He triplet transition.
This line has an intensity of about 10% compared to the main line. Therefore, the experimental data has to be recorded with high signal-to-noise ratio in order to distinguish this component from the noise. Use of the iStar ICCD camera provides the required S/N ratio and allows us to measure directly E-field based on passive emission spectroscopy. Moreover, the spectra have to be recorded with superior spectral resolution to be able to resolve these two components. This was achieved with 0.75 m Shamrock spectrograph equipped with 3600 g/mm grating and having 10 μm entrance slit.
To develop a reliable method for measuring the electric fields in the vicinity of an ICRF antenna, the first step is to observe the Stark effect due to a known DC field, in the same plasma that can be found in front of the antenna. Once the concept is confirmed, it is again used for the calibration of measurements conducted in the sheath in front of the antenna.
The optical emission spectra was recorded by a Shamrock 750 high resolution spectrograph (focal length 750 mm), equipped with an intensified CCD detector iStar 334, both from Andor Technology. The spectrometer is based on a Czerny-Turner optical design and is equipped with 3 gratings of 600, 2400 and 3600 lines/mm. The light was coupled to a 10 m long, broadband fibre via an aspherical 6 mm collimating lens with a confocal length of 8.7 nm and an adjustable focal point.
To detect the expected Stark-effect-induced changes on the spectral line profile, we have used a high-resolution grating with 3600 lines per mm that provides a spectral resolution of 0.02 nm. The discharge parameters for the dedicated set of experiments are listed in Table 2.
| Parameter | Value |
| P | 7.8 x 10⁻⁴ mbar |
| Gas | He |
| Gas Flow Rate | 60 sccm |
| BBigCoils | 0 T |
| BSmallCoils | 0. 0 I T |
| PPF-Helicon | 700 W |
| fHelicon | 11.76 MHz |
| Discharge duration | 12 s |
Table 2. Standard experimental conditions used for detection of the E-field from He I line emission.
Two experimental scenarios have been performed to obtain the results presented here. The reference data were recorded without the voltage applied to the electrode, while the second set was obtained for the set of experiments with the electrode biased to a positive DC voltage of Uel = 1 kV, which was the maximum voltage provided by the power supply.
The obtained line profiles, corresponding to the 43D - 23P transition in He-I, were recorded over the whole duration of a discharge, with an exposure time of 0.5 s, in a kinetic series of 24 scans per discharge. The intensifier in front of a CCD sensor of the spectroscopic system provided a relative gain of 8 counts per photoelectron per scan, contributing to the acceptable signal-to-noise ratio. To compare and time-average the recorded data, the scans corresponding to the stable plasma phase were selected, which was an interval of 5s, thus counting 10 scans per discharge. With the good reproducibility of the line being confirmed, the accumulated spectra were averaged over 4 discharges per scenario (with and without applied voltage on the electrode). This way each of the experimentally recorder line profiles presented here (Figure 3) are the result of 40 averaged spectra.
The processed data shows a reproducible shift of the He-I 43D - 23P line (Figure 3) when the external electric field is present in the thermal sheath in front of the DC-biased electrode.
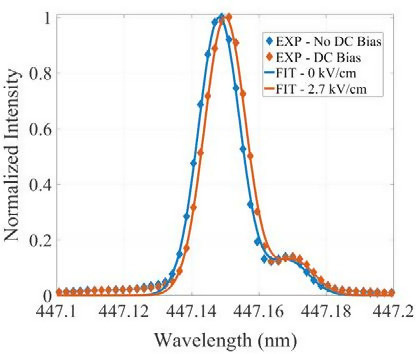
Fig. 3. Experimental 43 D - 23 P He I line profile for EDC = 0 kV/cm and EDC = 2.7 kV/cm (black and red diamonds, respectively) fitted with the simulated theoretical spectra calculated with the EZSSS code (solid lines).
For a rough estimate of the electric field expected in a thermal sheath in front of the electrode we can assume that it originates from the difference in potentials between the electrode and the plasma, over the distance corresponding to the sheath thickness. Compared to the potential applied on the electrode, Uel = 1 kV, the plasma potential is Upl = 0 kV. The sheath thickness corresponding to the density of helium plasma in IShTAR of ne = 1016 m-3, and the electron temperature of Te = 5 eV is proportional to the Debye length of λD = 5 x 10⁴ m.
Therefore the electric field in the vicinity of the electrode biased to Uel = 1 kV, can be estimated to be the applied voltage drop over the sheath thickness. To complete the study, the He-I 43 D 23 P transition is simulated with the EZSSS code for several values of the DC electric field, and the best match between the measured and simulated lines corresponds to a simulated spectral line exposed to the external electrical field of E = 2.7 kV/cm, as depicted in Figure 3 with the solid lines.
The estimated electrical field agrees with theoretical prediction and showing possibility of passive emission spectroscopy with high resolution to be used for E-field measurements. The results presented here are a successful conclusion of proof-of-concept experiments. This work has been carried out within the framework of the EUROfusion Consortium and has received funding from the Euratom research and training program 2014-2018 under grant agreement No 633053. The views and opinions expressed herein do not necessarily reflect those of the European Commission.

© Oxford Instruments 2026