Resources
 Part of the Oxford Instruments Group
Expand
Collapse
Part of the Oxford Instruments Group
Application Notes
Author: Justin Cooper, Andor Technology
Published: 01 Sep 2017 · Last updated: 28 May 2026
Tags: rs-app
Webinar: Raman Spectroscopy - A New Dawn In Clinical Diagnosis
Raman spectroscopy has become an extremely valuable tool for measuring and identifying chemical composition and molecular structures. Traditional applications of Raman spectroscopy focus on Stokes signals, 200 - 4000 cm-1 away from the excitation laser line. Access to the low frequency Raman region (<10 cm-1 - 200 cm-1) has traditionally been reserved for specialized instruments needed with suitable optical components. Here we look at an example with three forms of the drug Carbamazepine.
Introduction
The importance of Raman spectroscopy as an analytical tool is based on the ability to probe the unique vibrational and rotational modes of molecules. The frequencies of the transitions probed by Raman typically range from 200 - 4000 cm-1.
The low frequency Raman region (<10 cm-1 - 200 cm-1) probes the same low energy vibrational and rotational modes of molecular structures as terahertz spectroscopy (300 GHz - 6 THz). Many materials exhibit strong uniquely identifiable ultra-low frequency Raman spectra, characteristic of their low energy vibrational and rotational modes. Examples of some applications which take advantage of low frequency Raman signals are:
Obtaining these low frequency signals (<200 cm-1) has previously been difficult and costly due to the limitations of available filters for blocking the intense Rayleigh scattered laser light.
Experiment Setup
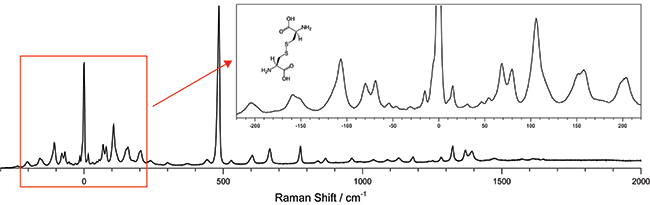
Figure 1: The low frequency Raman spectra of L-cystine showing both the low frequency stokes and anti-stokes region as well as the “finger print” region transitions. 532 nm excitation wavelength was used and the spectra was collected for a total integration time of 120 seconds using a Shamrock 303i equipped with a 1800 l/mm groove density grating and an iDus DU420A-OE detector.
A low frequency Raman spectrograph capable of measuring signals <10 cm-1 from the laser line was built and used to measure L-Cystine (Figure 1). The system, which is based on Ondax SureBlock ultra-narrowband filters and an Andor spectrograph, is much more compact, economical and easier to use than the triple stage spectrographs that are typically used to access these low frequency transitions. The high performance of the Ondax SureBlock filters enable access to the low-frequency region of Raman spectra with a conventional visible or NIR laser using only a low straylight, high dispersion single stage spectrograph. The combined system offers the advantage of being able to simultaneously measure both the low frequency Stokes and anti-Stokes signals without sacrificing the ability to measure traditional Raman shifts of 2000 cm-1 or more.
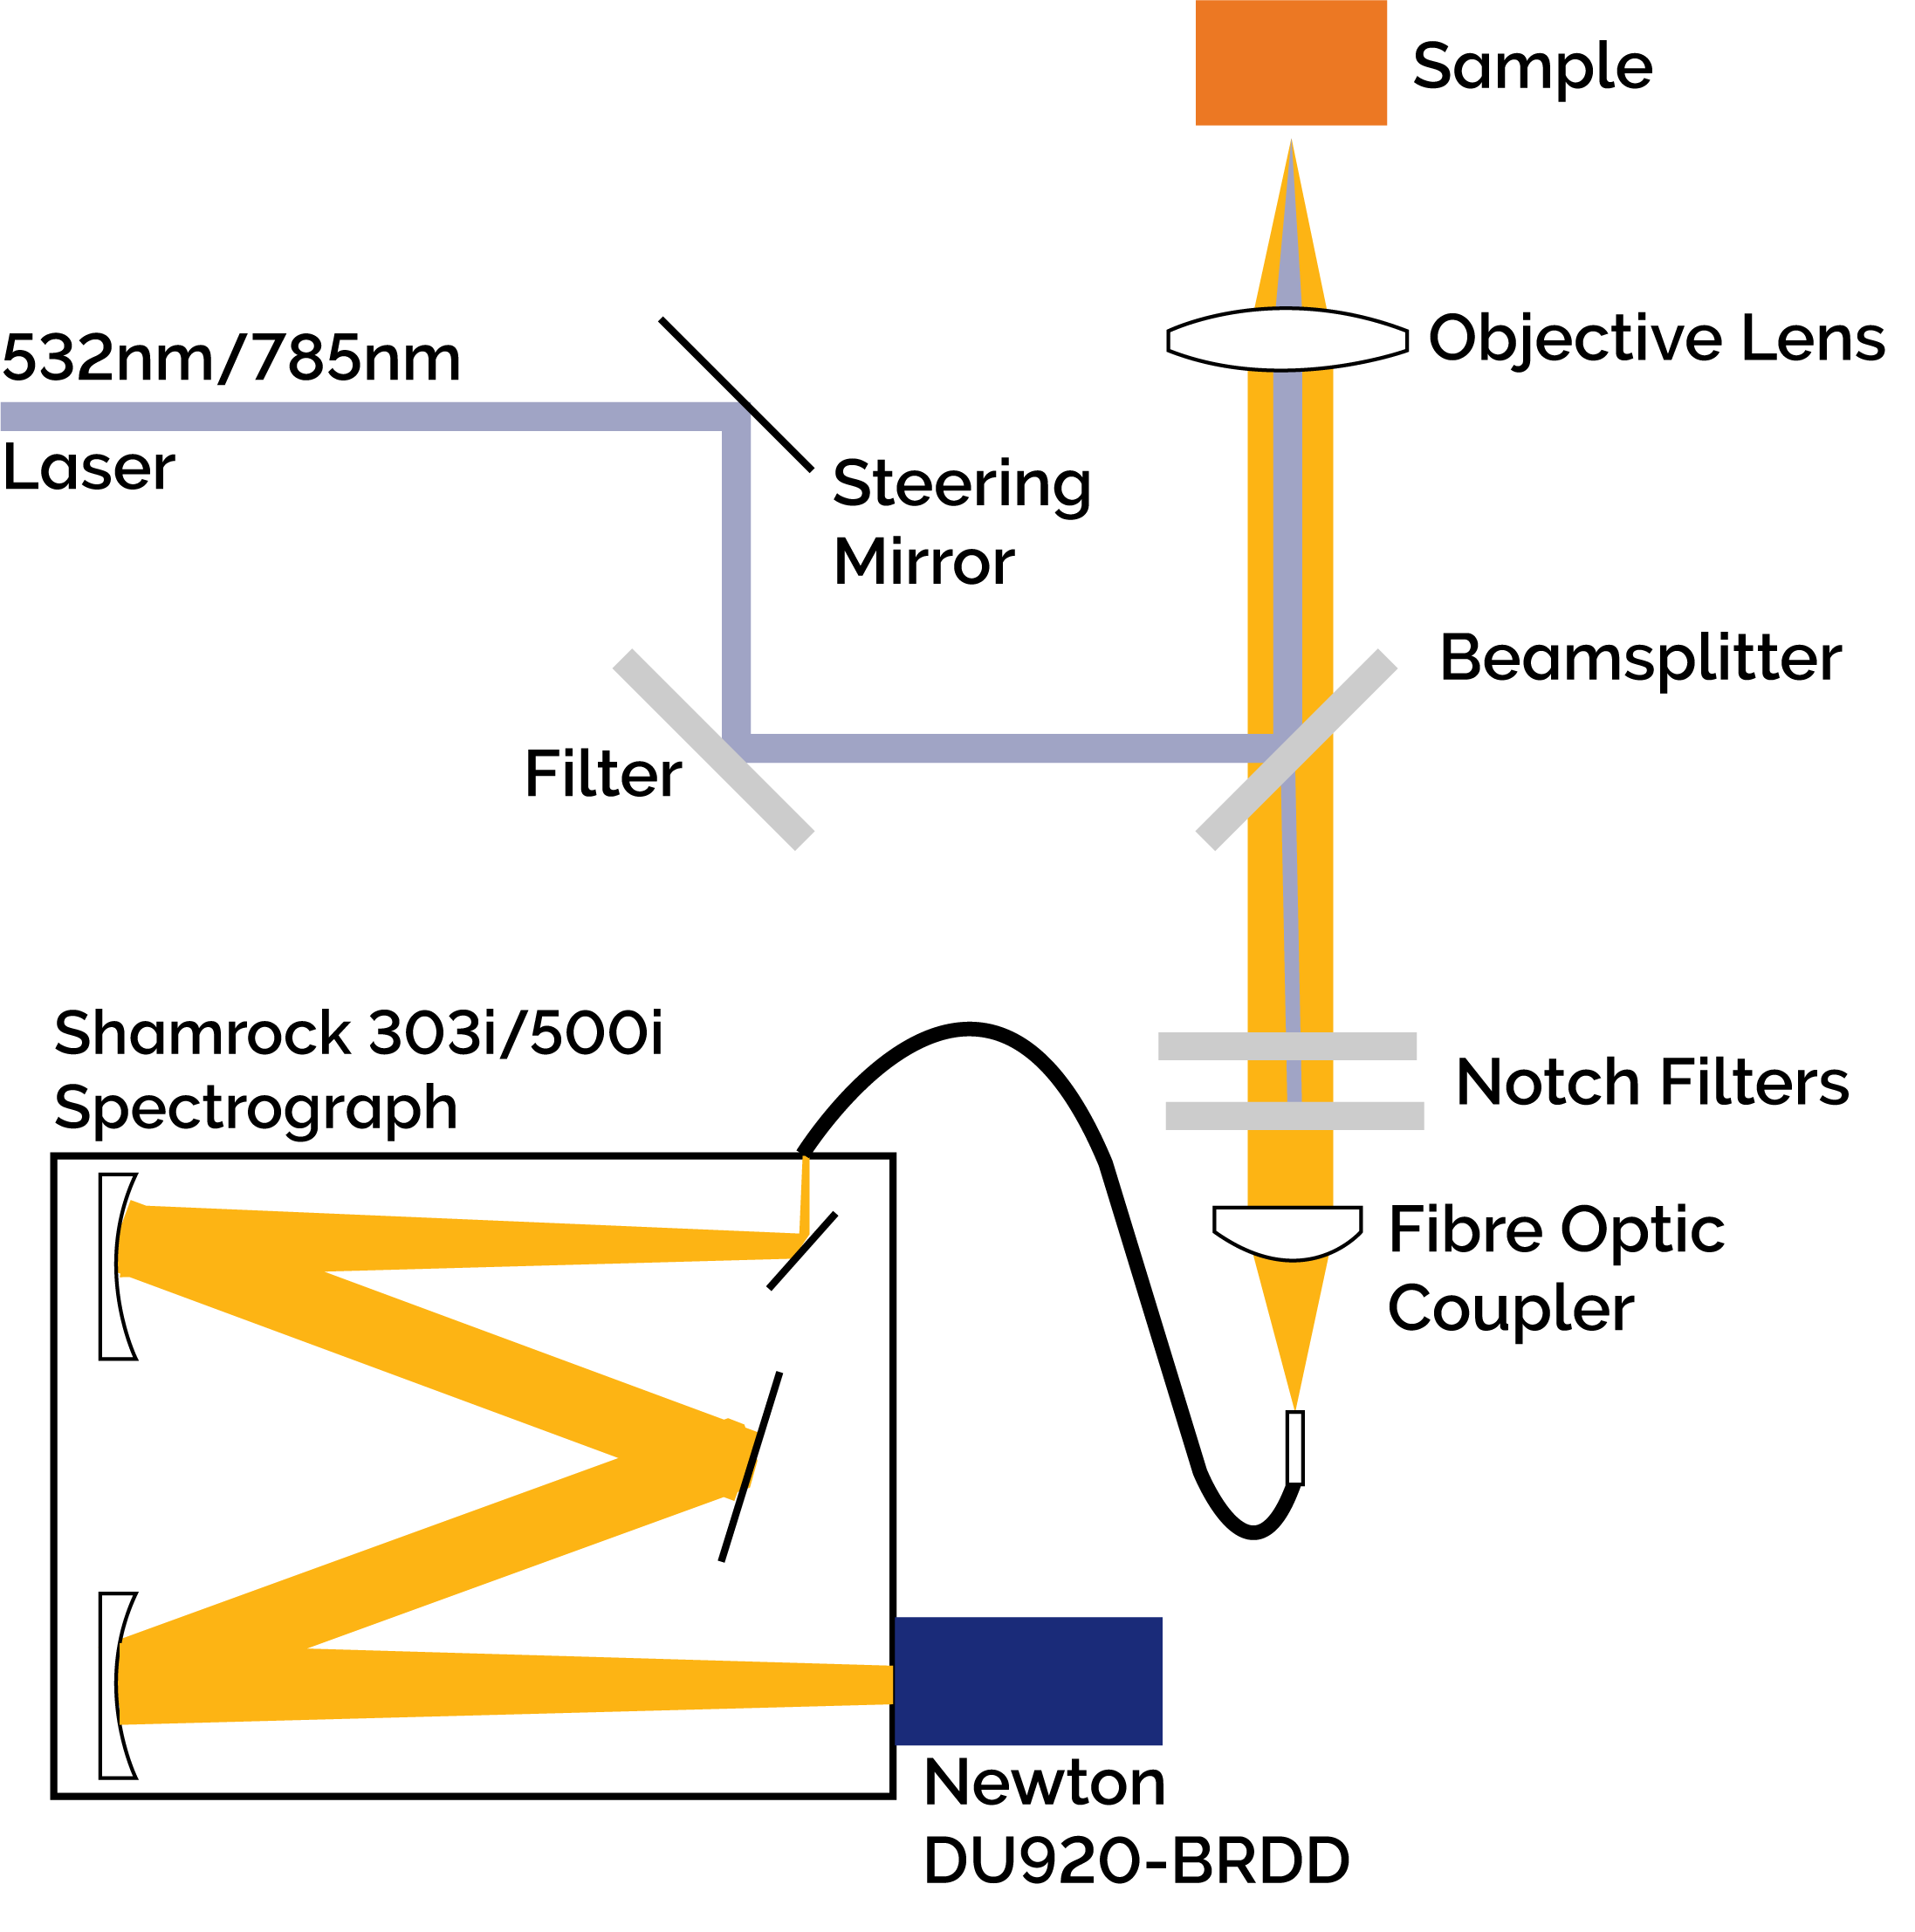
Figure 2: Diagram of the Low Frequency Raman Spectrograph. Collimated light from either the 785 nm or 532 nm excitation source was focused onto the sample after filtering and redirection by an ASE suppression filter and matching 90/10 beamsplitter (Ondax Incorporated). The resultant Raman signal was collected by the focusing objective and fibre coupled to either an Andor Shamrock 303i or Shamrock 500i after the Rayleigh scatter was removed by two Ondax SureBlock ultra narrowband notch filters. The dispersed light was detected by either a Newton DU920P-BRDD or an iDus DU420A-OE.
The Low Frequency Raman Spectrograph (Figure 2) consisted of either a 532 nm or 785 nm wavelength stabilized laser with the ASE removed using a narrow-band ASE suppression filter. A matching 90/10 beamsplitter redirected the beam towards an objective lens focused onto the sample of interest. The backscattered signal was re-collimated by the objective lens and in the return path, the 90/10 beamsplitter transmitted the Raman signal while reflecting 90% of the Rayleigh scattered light. Two Ondax SureBlock ultra narrow-band notch filters, each having optical density (O.D.) > 4, were used to block the remaining Rayleigh scattered light for an estimated total optical density of ~9. The filtered Raman signal was then fibre coupled to a spectrograph (Shamrock 303i or 500i) and onto either a back-illuminated deep depletion Newton CCD detector (DU920P-BRDD) or an open electrode iDus CCD detector (DU420A-OE). Typical integration times of 60 seconds were used to capture the Raman spectra.
To illustrate the ability to distinguish between different polymorphic structures, three different forms of carbamazepine (a common drug used as an anticonvulsant) were measured with the low frequency Raman spectrometer (Figure 3). The region from 20 - 60 cm-1 shows a clear distinction between the three different forms with virtually no overlap of the signals even though all three forms have identical chemical compositions with few distinguishing features in the “finger print” region of the Raman spectra.
This and similar low-frequency Raman measurements could be used in the development and production of pharmaceuticals and the synthesis of other chemical compounds to not only identify and verify the purity of a preparation but to also ensure the proper formulation has been prepared to FDA standards.
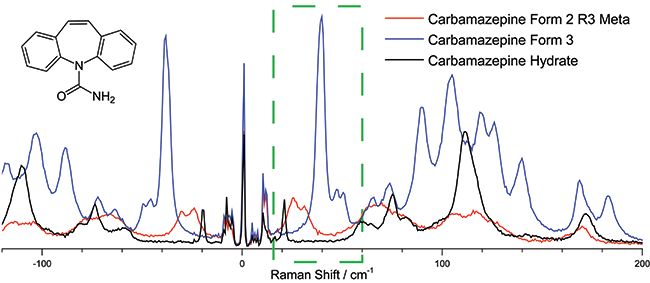
Figure 3: The 20-40 cm-1 region of the low frequency Raman spectra of Carbamazepine can be used to distinguish its various isoforms, a critical function in the manufacturing of the drug. Spectra were taken using the low frequency Raman spectrograph, the excitation wavelength was 785 nm and the spectra was collected with total integration time of 60 sec using a Shamrock 500i equipped with a 1200 l/mm groove density grating and an iDus DU420A-OE detector.
References

© Oxford Instruments 2026
