Resources
 Part of the Oxford Instruments Group
Expand
Collapse
Part of the Oxford Instruments Group
Application Notes
Author: R. Mundt, G. Ryseck, P. Gilch, Femtosecond spectroscopy group, Chemistry, University of Düsseldorf
Published: 01 May 2014 · Last updated: 16 Jul 2025
Tags: photonic-solutions-for-chemistry-lc, luminescence-app
The period of vibrational motions in molecules (10 – 300 femtoseconds(fs)) sets a lower limit for the time scale of chemical processes [1, 2]. Being able to measure the dynamics such chemical-bond changes provides valuable insight into the chemical mechanisms underlying molecular processes. Thanks to the advent of femtosecond lasers, these time scales are nowadays directly accessible [3]. The Femtosecond Spectroscopy Group in the Dept. of Chemistry, at the University of Düsseldorf outline in this short note how the optical Kerr effect can be utilised to achieve high temporal resolution measurements for very short fluorescent lifetimes on these timescales.
The basic experimental process involves an ultra-short laser pulse (pump) triggering the molecular process of interest. A second pulse (probe or gate) records changes in spectroscopic or diffraction patterns induced by the pump pulse. Commonly, the pump pulse promotes the molecule into an electronically excited singlet state. Fluorescence emission is a hallmark of such an excitation [4]. Tracing the fluorescence emission as a function of time and frequency, yields information on the fate of this state. One technique to resolve the fluorescence in time and frequency makes use of the optical Kerr effect [5].
On the femtosecond time scale, fluorescence spectra are often recorded by means of an optical gate (see Figure 1a). An optical gate cuts temporal slices out of the fluorescence decay and the timing of this “cutting” is controlled by a delay stage which sets the time interval, td , between excitation by the pump pulse and the gating. Repeating the experiment with different settings for delay, td , will yield the decay trace or profile. The Kerr effect is one such mechanism for implementing an optical gate (see Figure 1b).
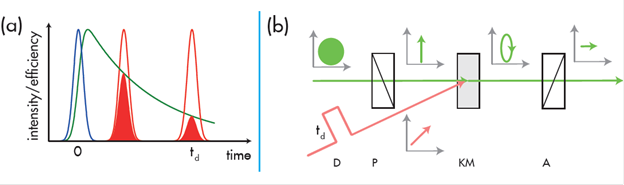
Figure 1: a) Principle of a pump-gate/probe experiment, b) Principle of an optical Kerr gate.
In a Kerr gate, the fluorescence first passes a linear polarizer P (refer to figure 1b). A second linear polarizer, the analyser A, is set perpendicular to P, hence extinguishing the transmitted emission signal. A Kerr medium (KM) is placed between the polarisers, A and P. In the normal state, it is an isotropic and transparent material which does not alter the polarization state of the transmitted light. However, when it is exposed to an optical gate pulse, an anisotropy is induced in the KM which leads to birefringence. In this state the KM alters the polarization state of the transmitted fluorescence light such that it is rotated, resulting in a portion of it being able to pass through the analyser, A. Glass plates are an example of possible Kerr media. When in the anisotropic state the system (A, P and KM) remains ‘open’ for a gating time of ~τg/√2 , where τg ≈ 50 – 100 fs is the duration of the gate pulse.
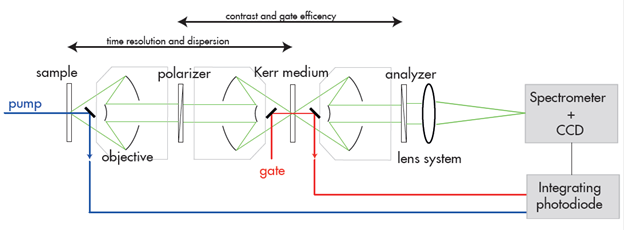
Figure 2: Schematic diagram for the experimental setup utilising the optical Kerr gate for time resolution. Key features are the use of reflective objectives and wire grid polarisers.
The design of the setup is depicted in Figure 2 and is similar to the one described in reference [6]. Pump and gate pulses are derived from a single femtosecond laser/amplifier system (Coherent Libra-HE), with a repetition rate of 1 kHz. This ensures straightforward synchronization of the pump and gate pulses. Using non-linear optics, the 800 nm light of the laser is frequency-converted to suitable wavelengths (~370 nm in this case) for the experiment. The frequency of the pump light is tuneable to match the optimum absorption of the molecules under study.
The pulses needed for gating the Kerr medium are converted to 1200 nm, thus avoiding spectral overlap with the fluorescent light from the sample. Reflective optics guide the fluorescence light from the sample towards the Kerr medium and then to the detector. Two crossed wire-grid polarizers embrace the Kerr medium. A fused silica plate acts as the Kerr medium. The design with reflective optics minimizes the dispersion or spread in arrival times for different frequency components of the fluorescence signal.
An Andor iDus, DU420A-BU, CCD detector in combination with a Shamrock, SR-303i-B, spectrograph (with 150 l/mm grating blazed at 500 nm) captures the fluorescence spectrum. The power of the pump and gate light pulses are measured by photodiodes connected to a low-noise integrator (WieserLabs, IPD4A). Monitoring of these signals allows for corrections due to variations in the light power from the laser from pulse to pulse. The integrator is synchronized using the “FIRE OUT” TTL trigger pulse from the iDus CCD camera, and the whole system is controlled by LabVIEW and the Andor Software Development Kit (Andor SDK).
It is useful to estimate the number of photons expected to land on the sensor for a typical measurement and compare this with the sensitivity of the camera to assess the quality and limitations of the expected signal-to-noise (SNR).
As an exercise, the number of photons per second (flux) which will impinge on the CCD can be estimated as follows with the noted considerations:
Taking all these factors into account, one may expect a maximum of ~ 80 photons per second per pixel.
The iDus CCD detector has a peak quantum efficiency of 0.9 and a high conversion sensitivity of 2 electrons per count. Still, at room temperature the contributions will be lost in the background fluctuations or noise due to dark current. The ability to cool the CCD chip to -100 °C solves this problem. In contrast to cooling with liquid nitrogen, the iDus uses thermo-electric elements simplifying daily operation and reducing running costs.
Samples consisting of the molecule N,N-dimethyl-para-nitroaniline (DMpNA) dissolved in acetonitrile were used to assess the performance of the system, including the sensitivity of the detector. This molecule is known to undergo ultrafast internal conversion, thereby depleting the emitting singlet state [8]. Illustrative temporal and spectral data are shown in figure 3. In the spectrally and temporally resolved scan, successive spectra were taken with a time interval (delay) of 67 fs between them. The acquisition or exposure time of the camera was set to 3 s per spectrum (~3000 pulses accumulated per measurement). To ensure minimal contribution for dark noise the detector was operated at -40 °C. The first acquired spectrum acted as a reference for the background contributions, and was subtracted from all subsequent spectra in the series. Apart from this subtraction, there was no further manipulation of the data.
The measured maximum signal, with respect to the delay time (td) and wavelength (or frequency) amounted to ~ 100 counts per second per pixel, which accords well with the estimate outlined above.
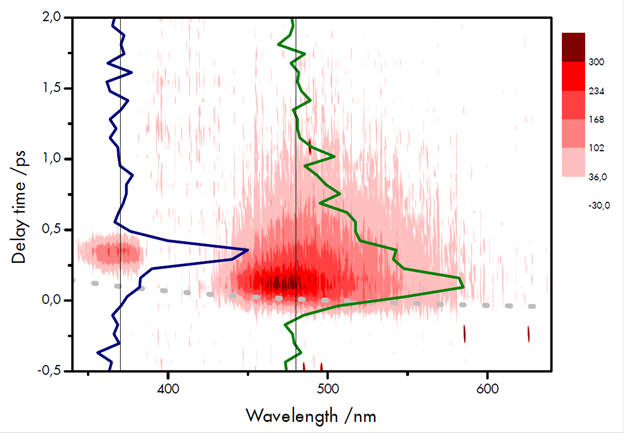
Figure 3: Spectrally and temporally resolved fluorescence of DMpNA dissolved in acetonitrile. The colour scale for the contour plot represents the number of counts. The time trace at the excitation wavelength (370 nm) (blue line) provides information on the instrumental response time. The trace at 480 nm (green line) corresponds to the fluorescence decay giving information on the lifetime. The grey dotted line describes the apparent shift of time zero due to dispersion.
The signal at 370 nm is due to scattered pump light and inspection of the respective time trace yields the instrumental response time (FWHM) of 180 fs. A time profile is shown at 480 nm for the fluorescence decay of the excited singlet state. The lifetime of this state can be estimated from the trace which comes out at ~ 480 fs.
It was noted that the signal quality can be improved further by correction for intensity fluctuations in pump and gate light powers. This is possible with the triggering capability of the Andor camera which can be synchronized with the reference diodes.
Conclusion
The group demonstrated a high-time-resolved broadband fluorescence spectroscopy technique based on the optical Kerr effect. It was shown that an optical Kerr gate is well-suited for the study of ultrafast decays of excited states. They have shown by estimation of the gated signal and detector sensitivity, that the iDus CCD detector can be used very successfully for femtosecond spectroscopy utilising optical Kerr gating with pulses on the femtosecond timescale.
Acknowledgment
The information and figures for this note have been gratefully received from Prof. Dr. P Gilch of the Femtosecond Spectroscopy Group, Department of Chemistry, University of Düsseldorf, Germany. The group’s work received financial support from the Deutsche Forschungsgemeinschaft (GI 349/4-1), and they gratefully acknowledge Martin Schramm for his technical support.
References

© Oxford Instruments 2026
