Resources
 Part of the Oxford Instruments Group
Expand
Collapse
Part of the Oxford Instruments Group
Application Notes
Author: Jan Versluis, Facility Scientist / Laser Safety Officer, Ultrafast Spectroscopy FOM-Institute AMOLF
Published: 01 May 2015 · Last updated: 16 Jul 2025
Tags: nl-spectroscopy-app
The interaction between water and hydrophobic molecular groups is of paramount importance in biological processes. For example, hydrophobic hydration is the driving force for protein folding and for lipids to self-assemble into bilipid membranes. All these processes are intimately related to the structure and dynamics of the water molecules that solvate the hydrophobic molecular groups.
An ideal technique to measure the structure of water at the water/hydrophobe interface is vibrational sumfrequency generation (SFG). In SFG, a tunable infrared light beam and a visible light beam are combined to generate light at their sum frequency. The generation is enhanced if the infrared light is resonant with a molecular vibration. SFG is a highly surface sensitive technique. The interface specificity arises from the fact that within the dipole approximation SFG can occur only in media that lack inversion symmetry. Most bulk materials are oriented randomly, meaning that they have inversion symmetry, but at the interface this symmetry is broken. As a result, SFG selective probes the layer of water molecules that is in direct contact with the hydrophobic material. The SFG spectrum provides detailed information on the vibrations and the relative orientations of the molecules at the interface.
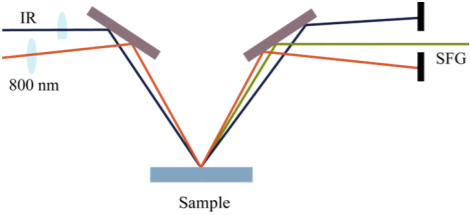
Figure 1: Schematic representation of SFG generation. A visual and an infrared beam are focused on the sample to create a light at their sum frequency. The SFG signal is measured with a sensitive spectrometer.
SFG generation
The laser source for the SFG setup is a regenerative Ti:Sapphire amplifier (Coherent) producing 800 nm pulses at a 1 kHz repetition rate with a pulse duration of 35 fs and a pulse energy of 3.5 mJ. Approximately two thirds of the laser output is used to pump a homebuilt optical parametric amplifier and a differencefrequency mixing stage. This nonlinear optical device produces tunable broadband mid-IR pulses (wavelength 2-10 μm, 600 cm-1 bandwidth (FWHM), pulse energy 10- 20 μJ). The IR pulses have a sufficiently large bandwidth to measure the complete SFG spectrum of the OH (OD) stretch vibrations of H2O (D2O). Another part of the 800 nm pulse is sent through an etalon to narrow down its bandwidth to ~15 cm-1. The resulting narrow-band 800 nm pulse (VIS) and the broadband IR pulse are directed to the sample surface at angles of ~50° and ~55°, respectively, to generate light at their sum frequency. The VIS and IR beams are focused in spatial and temporal overlap on the sample surface with 200 mm and 100 mm focal length lenses, respectively.
SFG detection
The SFG light generated at the surface is sent to a spectrograph (Shamrock SR-303i-A-SIL, Andor Technology) and is detected with an Electron-Multiplied Charge Coupled Device (Newton DU970P-BV, Andor Technology). The spectrometer and EMCCD camera have been selected to maximize the overall quantum efficiency of the detection scheme and to minimize detection noise. The EMCCD camera window has a custom anti-reflection coating to reduce losses. The spectrograph has silver coatings on all optics to enhance the throughput at 620-680 nm. To obtain the highest possible signal to noise, we use hardware binning, high sensitivity mode, and a 50 kHz readout speed. The typical integration time for taking a SFG spectrum is 5 minutes. Typical photon counts per pixel are 1000, resulting in a SN ration better than 30. Due to the low read-out noise of the EMCCD camera these measurements are shot noise limited.
The camera is operated at -70 degrees Celsius (aircooled Peltier elements) to suppress dark current noise. All spectra in this application note were recorded with s-polarised SFG, s-polarised VIS, and p-polarised IR (with respect to the plane of incidence). The spectra are normalized to a reference SFG spectrum measured from z-cut quartz in a vial containing saturated D2O vapor and alkane vapor (the latter for the experiments on the D2O/hexane and D2O/heptanes interfaces). The frequency resolution of the measured spectra is determined by the bandwidth of the VIS beam and amounts to ~15 cm-1.
In Figures 2-3 we present SFG spectra of D2O/hexane and D2O/heptane interfaces. The spectra are compared with the SFG spectrum of water/air. For all interfaces the spectrum contains a double-peak structure with maxima at 2350 and 2500 cm-1 and a more narrow peak at 2730 cm-1. The double peak structure is associated with D2O molecules forming hydrogen bonds to other D2O molecules, the peak at 2730 cm-1 is associated with OD groups sticking out of the surface (dangling OD groups). It is clearly seen that the SFG spectra of D2O/hexane and D2O/heptane interfaces have a much higher amplitude than the SFG spectrum of the D2O/air interface. This increase in SFG intensity cannot be caused by changes in Fresnel factors. It has been shown that the dispersion of bulk water leads to an enhancement of the local infrared electric field at frequencies well above the hydrogen-bonded region of the absorption spectrum, i.e. for D2O at frequencies >2700 cm-1.
The SFG intensity is proportional to the net ordering of the probed molecular vibrations. Hence, the strong increase in SFG intensity indicates that there are more water molecules pointing with their dipoles perpendicular to the surface at the D2O/hexane and D2O/ heptane interfaces. This indicates that water molecules at hydrophobic interfaces are less randomly oriented than at the water/air interface. It is also seen in figures 2 and 3 that for the D2O/hexane and D2O/heptane interfaces the low-frequency peak is stronger than the high-frequency peak, whereas for the D2O/air interface the two peaks are of nearly equal intensity.
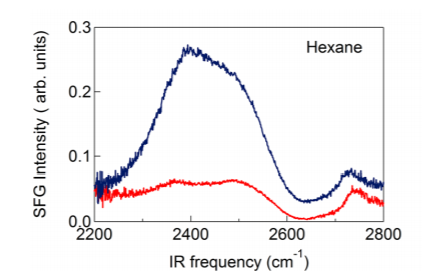
Figure 2: SFG spectra of a water/hexane interface (blue) and a water/air interface (red).
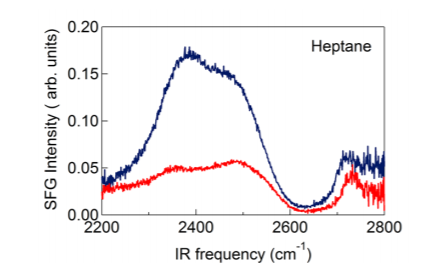
Figure 3: SFG spectra of a water/heptane interface (blue) and a water/air interface (red).
In a recent study, it was shown that these two peaks result from a Fermi resonance of the symmetric OD stretch vibration and the overtone of the bending mode. The coupling of the OD stretch and the overtone of the bending vibration leads to a so-called Evans window (region of lower intensity) within the broadband of the symmetric OD stretch vibration, thus giving rise to the appearance of a double-peak structure. The relative intensities of the two peaks around the Evans window are dependent on the average H-bond strength of the water molecules at the interface. In case the hydrogen bonding is enhanced the spectral distribution of OD oscillators will shift to lower frequencies, with the result that the low-frequency peak becomes stronger than the high-frequency peak. The free OD peak at 2745 cm-1 is not strongly affected by the presence of a hydrophobic layer. The peak is slightly red-shifted by ~20 cm-1 and somewhat broadened, probably as a result of the van der Waals interactions between the water molecules at the interface and the molecules in the hexane and heptane layers.
Enhanced ordering of water at hydrophobic surfaces Strazdaite, Simona and Versluis, Jan and Backus, Ellen H. G. and Bakker, Huib J., The Journal of Chemical Physics, 140, 054711 (2014), DOI:http://dx.doi. org/10.1063/1.4863558
Vibrational Response of Hydrogen-Bonded Interfacial Water is Dominated by Intramolecular Coupling Sovago, Maria and Campen, R. Kramer and Wurpel, George W. H. and Müller, Michiel and Bakker, Huib J.and Bonn, Mischa, Physical Review Letters, 100, 173901 (2008), http://link.aps.org/doi/10.1103/ PhysRevLett.100.173901

© Oxford Instruments 2026
