Resources
 Part of the Oxford Instruments Group
Expand
Collapse
Part of the Oxford Instruments Group
Application Notes
Author: Steffen Rieger and Prof. Dr. Carsten Fallnich, Institute of Applied Physics University of Münster
Published: 01 Nov 2016 · Last updated: 16 Jul 2025
Tags: rs-app
Since its discovery, Raman scattering spectroscopy has become an important method for the investigation of the chemical composition of samples in the material, as well as, life sciences. In contrast to fluorescence microscopy techniques, for which it is necessary to attach fluorophores to certain molecules, Raman scattering techniques have the advantage of using molecular vibrations. They therefore provide chemically selective information without changing the chemical behaviour of the sample. Additionally, the polarization state of the Raman scattered light can be determined and used to gain even more information, e.g., on the symmetry of molecular vibrations or the orientation of the molecules.
We developed a confocal Raman microspectroscope (see Fig. 1) based on a continuous-wave laser at a wavelength of 640 nm as a light source. The laser power was controlled by rotating a half-wave plate (HWP) in front of a polarizing beam splitter (PBS). The beam was adjusted in its linear polarization angle by another HWP and expanded by a telescope setup consisting of two lenses. The laser beam then passed through a dichroic mirror (DM) with a filter edge at 650 nm into a microscope objective (MO) with 100-fold magnification, with which it was focused onto the sample. The sample was fixed on a scanning positioning stage.
The Raman scattered light, red-shifted to the wavelength range between 660 nm and 830 nm, passed in the backwards direction through the MO and was transmitted by the dichroic mirror. A confocal setup, consisting of two lenses (L) and a pinhole (PH), was used to block light that did not originate from the focal volume on the path to the detector. The remaining light was transmitted through a quarter-wave plate (QWP) and a polarizer (P), which enabled polarization-sensitive measurements, and was then focused on the input slit of a spectrograph (Andor Shamrock SR-500i-D1-SIL) with attached EMCCD detector (Andor Newton DU970P-BVF).
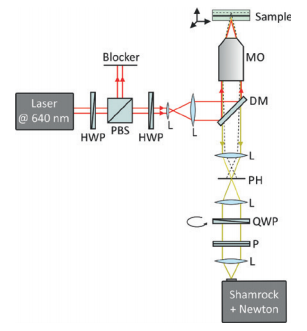 Figure 1: Setup of the Raman microspectroscope. The excitation laser passes a power control consisting of a half-wave plate (HWP) and polarizing beam splitter (PBS), is adjusted in its polarization with another HWP, expanded with a set of lenses (L), and reflected by a dichroic (DS) mirror through the microscope objective (MO) into the sample. The Raman scattered light is collected in backwards direction with the MO, transmitted through the DM, and passes a confocal setup consisting of two lenses (L) and a pinhole (PH). It is then sent through a polarization detection setup with quarter-wave plate (QWP) and polarizer (P) and focused by another lens (L) into the spectrometer.
By rotating the QWP in front of the polarizer, a periodic modulation was observed in the signal intensity of the spectrometer as a function of the QWP angle θ (see Fig 2).
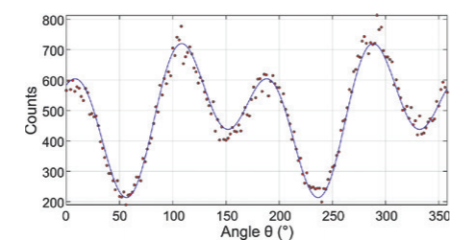 Figure 2: Measurement of the Stokes vectors: The intensity is plotted against the angle of a rotating quarter-wave plate for a specific wavelength (here, e.g., at 786 nm). The blue curve is obtained by fitting equation (1) to the data.
This effect was used to determine the polarization state of the Raman scattered light. Calculating the transmission function of the two optical components from their corresponding Müller matrices leads to an equation
 with S0 ’,S1 ’,S2 ’,and S3 ’ being the Stokes parameters, which describe the polarization state of the detected light and could be determined by fitting Eq. (1) to the measured data. Conventionally, the Stokes parameters are shown in their normalized representation: Si = Si ’/S0 ’ .
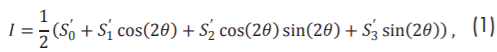
In Fig. 3 the result of a polarization-sensitive measurement of the Raman spectrum of cyclohexane with an integration time of 3 s and a Raman laser power of 7 mW is depicted.
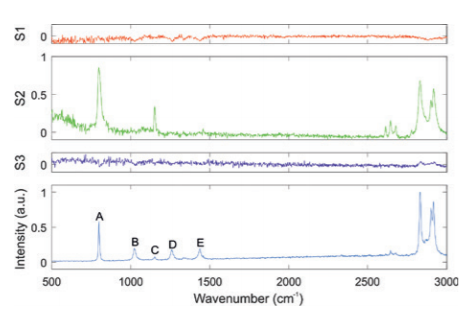 Figure 3: Stokes parameters S1, S2, and S3 in comparison to the spectrum of cyclohexane. The vertical scale is equal for the three upper diagrams.
The incident polarization was linear (oriented parallel to S2 ). As can be seen, the detected Raman signal was polarized parallel to the incident light with S1 and S3 being zero over the entire spectrum, which is expected for isotropic samples.
Some of the resonances (A and C) in the characteristic spectral region show different values for S2 , while others disappear completely in the polarization diagram. This is a result of the different symmetry of the underlying molecular vibrations and can be quantified by the depolarization ratio ρ of a resonance.
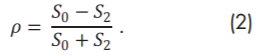
As the orientation of molecules in a liquid is equally distributed, the depolarization ratio of the visible resonances in the polarization spectrum could be determined by calculating
 For the cyclohexane sample from Fig. 3, values of ρA=0.08 and ρC=0.49 were measured for resonances A and C, respectively. This marks them as totally symmetric vibrations in contrast to non-totally symmetric vibrations, which always show ρ=0.75. This measurement demonstrates that, by using polarization-sensitive detection, Raman resonances of different symmetry can be distinguished, presenting an additional contrast mechanism within chemically selective Raman spectroscopy.
Additional insight is gained by investigating samples, whose molecular orientation is not isotropic but aligned towards a common direction, such as liquid crystals.
Fig. 4 shows the polarization state of the Raman scattered light of the liquid crystal 5CB measured at two different locations in the sample (blue and green dots). It can be seen that for this sample the polarization of Raman-scattered light did not match with the polarization of the incident light (marked as red dot). It instead follows the alignment of the molecules that is dominant at the respective position in the sample. This is a demonstration for the applicability of polarization-sensitive Raman scattering spectroscopy to anisotropic samples, for which it is a suitable method to directly gain information about the local alignment of molecules.
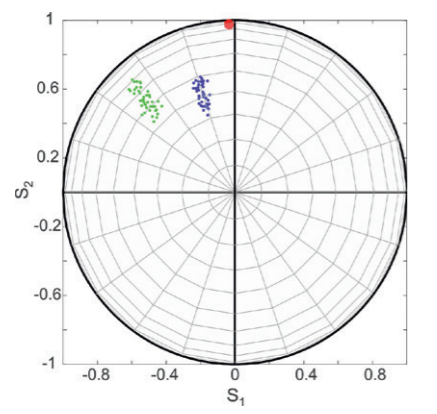
Figure 4: Polarization states of Raman scattered light from a liquid crystal (5CB). The parameter S3 is not shown as it is zero for all measurements. Each individual dot represents the polarization state of a different wavelength. Blue and green dots are taken from different measurements at different positions of the liquid crystal. The red dot marks the polarization state of the incident light.
We used a home-built spontaneous Raman microspectroscope with an Andor Shamrock 500i spectrograph and an Andor Newton 970 EMCCD detector to investigate isotropic and anisotropic samples in respect to the polarization of their Raman scattered light. Our results lead to insight on the vibrational symmetry and the orientation of molecules in these samples.
S. Rieger, C. Mannweiler, C. Fallnich, Institute of Applied Physics, University of Münster, Germany (November 2016).

© Oxford Instruments 2026
