Resources
 Part of the Oxford Instruments Group
Expand
Collapse
Part of the Oxford Instruments Group
Application Notes
Author: J. Quino, Andreas Bräuer, Lehrstuhl für Technische Thermodynamik (LTT) and Erlangen Graduate School in Advanced Optical Technologies (SAOT), Friedrich-Alexander-Universität Erlangen-Nürnberg
Published: 01 Feb 2017 · Last updated: 16 Jul 2025
Tags: rs-app
Aerogel is a unique type of solid porous material possessing remarkable thermal, optical, acoustic and mechanical properties which are important for various applications. It is derived by drying an alcogel at high temperature and elevated pressure conditions. In this work, the transport mechanisms occurring during the alcogel drying process were studied using an in situ measurement technique. Raman spectroscopy, which is an inelastic laser light scattering process, was used to measure spatial- and time-resolved concentration profiles developing within the gel. From the concentration profiles, both the drying kinetics and the transport quantities can be derived and investigated.
In order to carry out the measurement, Figure 1 shows the experimental setup that measures the concentration profiles inside the gel. The gel was placed inside the optically-accessible autoclave which was thermally regulated at 45 °C and continuously purged with carbon dioxide (CO2) at the constant pressure of 9 MPa.
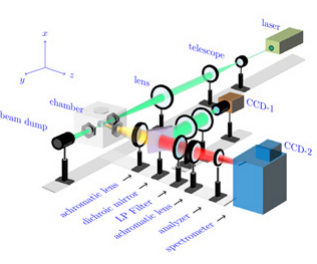
Figure 1: Experimental setup to measure the concentration profiles.
During the drying process, a continuous wave Nd:YAG laser (λ=532 nm, P=0.4 W) is collimated by a Galilean telescope and focused into the gel inside the autoclave by a long focal-length lens (f=500 mm). The waist of the laser focus builds up the one-dimensional measurement volume through the gel. Depending on the type of measurement, the gel can be positioned relative to the laser beam probe volume, for the recording of the Raman signals either in radial or axial configuration as sketched in Figure 2.
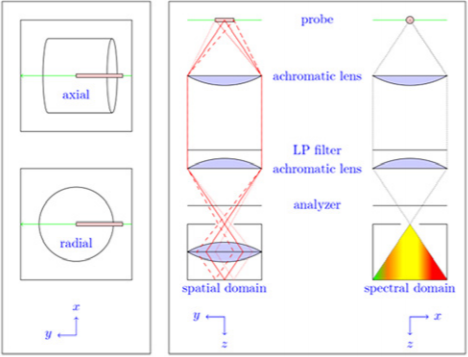
Figure 2: Illustration of simultaneous spatial and temporal measurements
The light scattered perpendicular to the propagation of the laser beam is detected through an achromatic lens. After placing a long-pass filter next to the achromatic lens, the elastically scattered light is blocked. It therefore transmits only the red-shifted inelastically scattered light. A second achromatic lens focuses the remaining Raman signal onto the entrance slit of the imaging spectrometer (Andor Shamrock SR-303i-A), with an analyzer, allowing only s-polarized scattered light to enter. As the imaging spectrometer conserves the spatial information along the waist of the laser focus, the scattered light can be detected spatially-resolved along the spatial axis of the EMCCD camera attached (Andor Newton DU971P-BV). On the other hand, the detected light is dispersed into its wavelength components by a grating with 1200 lines per mm inside the spectrometer, defining the remaining axis of the 2-D detector as spectral axis. Therefore, the spectral signature from several positions along the 1-D measurement volume can be acquired with a single image.
Figure 3 reveals three different Raman spectral images recorded at the three different time scales representing the spectra at initial (t1), intermediate (t2), and final (t3) drying time.
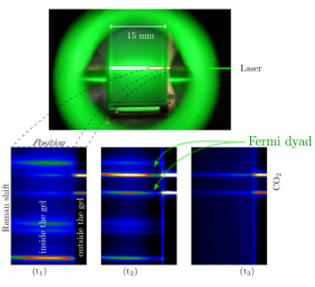
Figure 3: Raman spectral images acquired at three different times.
By analyzing each spectrum in the image, a one-dimensional concentration profile can be derived from each image. The performance parameters are listed in detail in Table 1.
| Parameter | Spatial axis | Spectral axis |
| Pixels | 400 | 1600 |
| Binning | 10 | 2 |
| Covered range | 6.40 mm | 450 - 2266 cm-1 |
| Resolution | 160 µm | 3.03 cm-1 |
| Exposure time | 8 s | |
| Kinetic cycle time | 30 s | |
At the beginning of the drying process, the acquired Raman spectral images reveal only the fingerprints attributable to ethanol, which was present inside the gel. As soon as the CO2 is fed into the autoclave to initiate the drying process, the recorded spectral images show an increasing amount of CO2 content over time as depicted by increasing intensities of CO2 Fermi dyad. To monitor the kinetics of this diffusion process, images were taken every 30 s until the CO2 has completely replaced the ethanol solvent inside the gel as shown in Figure 4.
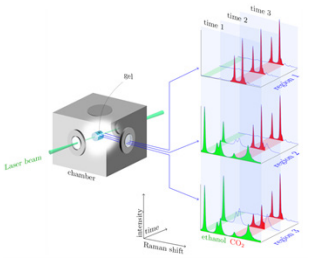
Figure 4: Illustration of the evolution of the measured Raman spectra.
For the interpretation of the recorded spectra, a calibration of CO2 and ethanol was performed separately to convert the intensity ratios of the signal representing the CO2 to the ethanol.
The result of the calibration allowed us to obtain the composition profiles developing throughout the drying process. Figure 5 shows an example of the measured composition profiles which clearly distinguishes the composition measured inside from the outside of the gel.
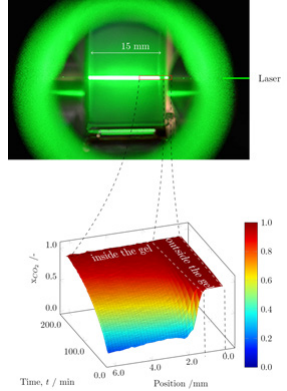
Figure 5: Composition profiles developed over time.
To analyze the diffusion process the composition profiles measured exclusively inside the gel are converted into CO2 concentration profiles by means of an equation of state. Using the diffusion models for cylindrical gels, the measured concentration profiles are fitted to these models to derive the diffusion coefficient. Various insights of the drying process can be extracted based on the derived diffusion coefficients upon varying the drying parameters.
J. Quino, Institute of Engineering Thermodynamics, Erlangen Untiversity, Germany (February 2017)

© Oxford Instruments 2026
