Resources
 Part of the Oxford Instruments Group
Expand
Collapse
 Part of the Oxford Instruments Group
Andor is proud to launch a revolutionary new initiative for light microscopy, developed through intensive collaboration with imaging experts in the scientific community. For years, microscopists have struggled with the challenge of quality control, and how to apply quantitative methods to research in the absence of fixed specifications and means of monitoring performance.
Andor's Installation Qualification (IQ) / Operational Qualification (OQ) programme, designed for its series of BC43 Benchtop Microscopes, changes that by promoting standardised procedures, reducing variability, and enhancing the reproducibility of results.
Robust. Repeatable. Reliable.
Enquire Now Learn More Discover BC43 Ask a QuestionAll light microscopes represent an image which is defined by physical limitations. With this new approach to quantifiable performance, we can start to apply knowledge of the performance limitations, otherwise known as the information limit, to experiment design. This approach results in more tightly controlled experiments, allowing different methods and techniques.
Point-spread function (PSF) is a measure of system resolution, usually determined by imaging the spatial extent of a small point-source of light (a fluorescent microsphere for example), and then measured using an image analysis routine ((MetroloJ_QC plugin or PSFj).
Cédric Matthews and Fabrice P. Cordelieres: “MetroloJ: an ImageJ plugin to help monitor microscopes’ health,”
Faklaris et al, J Cell Biol (2022) 221 (11): “Quality assessment in light microscopy for routine use through simple tools and robust metrics”
PSFj: know your fluorescence microscope
The graph on the right shows both lateral and axial resolutions of different types of fluorescent microscopes as a ratio of the theoretical full width half-maximum (FWHM).
Acceptable normalized resolution ratios, as determined by Faklaris et al, have a ratio value of 1.5 or less (green lines). Green emission channel (GFP) ratios presented.
Light microscopes are dynamic instruments, often used by a multitude of users with differing needs on a day-to-day basis. For researchers and lab owners who need to demonstrate system performance, our IQ / OQ programme provides the framework required to ensure your system is delivering the same performance on its first day as its last day.
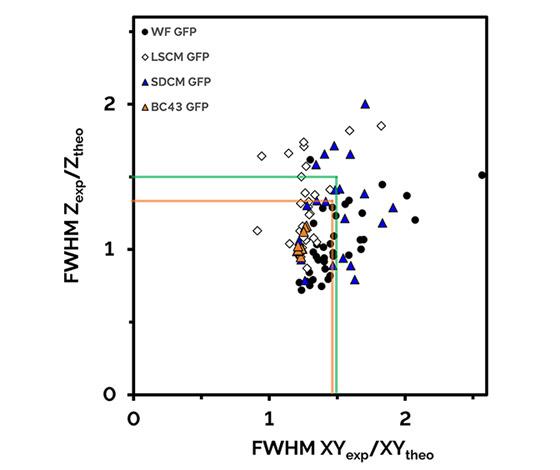
Marker legend: WF = Widefield epifluorescence microscopes. SDCM = Spinning Disk Confocal Microscopes. LSCM = Laser Scanning Confocal Microscopes. BC43 = Andor Benchtop Confocal Microscopes.
Andor’s guaranteed minimum resolution ratios (1.47 lateral and 1.34 axial) when using a 60x 1.42 NA oil immersion objective lens are indicated by the orange lines. Example resolution performance measurements for several identical BC43 units using this type of objective lens are indicated by the orange triangle markers. Figure developed developed from data and specifications from a paper published by Faklaris et al.
Learn More about our Quality Control PackagesThe specification table below details the imaging performance of BC43 microscopes equipped with a 60x 1.42 NA objective lens.
Our optional quality control service package will quantify the actual performance of your system within our published specifications. Every performance check carried out in your facility will result in a report provided to you detailing the actual measured performance. If any test fails during the scheduled periodic checks, our engineers will rectify to ensure continued performance within specification.
| OQ Test | Blue Channel Specification 405 nm Excitation 435-455 nm Emission |
Green Channel Specification 488 nm Excitation 517-541 nm Emission) |
Yellow Channel Specification 561 nm Excitation 580-610 nm Emission |
Red Channel Specification 638 nm Excitation 671-745 nm Emission |
| Laser Power* | P ≥ 12.5 mW | P ≥ 8.5 mW | P ≥ 9.5 mW | P ≥ 12.0 mW |
| System Uniformity | U ≥ 20% | U ≥ 65% | U ≥ 65% | U ≥ 65% |
| Illumination Centering | C ≥ 65% | Centering performance for other channels exceeds our measuring sensitivity | ||
* This test uses the epifluorescence (widefield) imaging mode of the microscope. All other tests utilize the confocal imaging mode of the microscope.
| OQ Test | Blue-to-Green Channel Pair Specification | Green-to-Yellow Channel Pair Specification | Green-to-Red Channel Pair Specification |
| Full Field of View Maximum Lateral Separation Distance (Lateral Co-registration) | Max |rxy| (Full FOV) ≤ 480 nm | Max |rxy| (Full FOV) ≤ 340 nm | Max |rxy| (Full FOV) ≤ 620 nm |
| Full Field of View Average Axial Separation Distance (Axial Co-registration) | Avg |rz| (Full FOV) ≤ 505 nm | Avg |rz| (Full FOV) ≤ 410 nm | Avg |rz| (Full FOV) ≤ 870 nm |
| Full Field of View Channel pair Co-registration (QUAREP Normalization) | Max |rexp / rref| (Full FOV) ≤ 3.17 | Max |rexp / rref| (Full FOV) ≤ 1.93 | Max |rexp / rref| (Full FOV) ≤ 3.61 |
| Central 30% Field of View Maximum Lateral Separation Distance (Lateral Co-registration) | Max |rxy| (30% FOV) ≤ 180 nm | Max |rxy| (30% FOV) ≤ 150 nm | Max |rxy| (30% FOV) ≤ 205 nm |
| Central 30% Field of View Average Axial Separation Distance (Axial Co-registration) | Avg |rz| (30% FOV) ≤ 505 nm | Avg |rz| (30% FOV) ≤ 410 nm | Avg |rz| (30% FOV) ≤ 870 nm |
| Central 30% Field of View Channel pair Co-registration (QUAREP Normalization) | Max |rexp / rref| (30% FOV) ≤ 1.55 | Max |rexp / rref| (30% FOV) ≤ 1.07 | Max |rexp / rref| (30% FOV) ≤ 1.89 |
* This test uses the epifluorescence (widefield) imaging mode of the microscope. All other tests utilize the confocal imaging mode of the microscope.
Understanding the exact performance of a microscope is crucial for experiment validation. Our goal is not only to provide owners and laboratories with a quality control programme to ensure consistent system performance, but also to provide researchers with the information they need to plan their experiments.
Our system tests provide researchers with hard data on the individual system parameters that influence their experiments. The tests use a mix of samples and software best adopted to each parameter.
The programme has been developed in collaboration with QUAREP-LiMi, an initiative with over 600 members from academia and industry, which is aiming to improve the reproducibility of light microscopy experiments in life and material sciences.
In this video, Dr. Glyn Nelson outlines how this approach to quality control contributes to the credibility of research conducted with microscopy techniques, and advances the pursuit of scientific knowledge.