Resources
 Part of the Oxford Instruments Group
Expand
Collapse
Part of the Oxford Instruments Group
Technical Article
Author: Prof. Jozef Kaiser, CEITEC Brno University of Technology
Published: 01 May 2020 · Last updated: 28 May 2026
Tags: libs-app
The technique known as “chemical mapping” or “chemical imaging” is of a great interest in the field of chemical material analysis. It can provide, in very clear visual form, information about the surface distribution of the individual chemical elements in the analysed area. Laser-Induced Breakdown Spectroscopy (LIBS) is one technique now being explored by researchers [1, 2, 3] for building up elemental chemical maps. LIBS can bring a number of benefits to this analysis such as relatively high speed of data acquisition and having no need of any special sample preparation. The resulting chemical map contains spectroscopic traces or ‘fingerprints’ of all the chemical elements present in the sample surface layers. Spatial resolution can go down to tens or even a few microns with the ‘limit of detection’ (LOD) usually in tens to hundreds of parts per million (ppm).
A group in the ‘Laboratory of Laser Spectroscopy’ at the Institute of Physical Engineering, Brno University [3], Czech Republic, under the guidance of Prof Jozef Kaiser, have successfully demonstrated chemical mapping based on LIBS spectroscopy. The group used dual pulsed laser sources, an echelle spectrograph and ICCD camera, and a special custom-built interaction chamber, to analyse the distribution of various chemical elements on the surfaces of cut specimens of various rocks.
An analytical method known as Laser-Induced Breakdown Spectroscopy (LIBS) uses the optical emission of the plasma plume to determine the elemental composition of the analysed material [1]. The plasma plume is produced on the sample surface by a focused laser pulse. This type of atomic emission spectroscopy (AES) technique, where the excitation energy is in the form of a laser pulse, brings to the field of material analysis a number of significant advantages.
Advantages of LIBS include:
Despite the fact that there are still some drawbacks, e.g. the problematic quantitative analysis, matrix effects and relatively poor limits of detection (LOD, generally 1-100 ppm), LIBS has become a respected technique, complementary to the well-known techniques of chemical material analysis, such as Atomic Absorption Spectroscopy (AAS), X-Ray Fluorescence (XRF), Inductively Coupled Plasma Mass Spectroscopy (ICP-MS), and many others.
The LIBS laboratory at Brno University of Technology (Brno, Czech Republic) [3] has been working with the LIBS method for more than 15 years with special focus on biological, geological and archaeological samples. The laboratory utilizes ‘Double-Pulsed LIBS’ (DP-LIBS), among its techniques for generating the plasma, and LIBS and LIFS (Laser-Induced Fluorescence Spectroscopy) for spectral analysis. Recently it has also become interested in LIBS analysis of liquids (Liquid LIBS) and the development of a mobile Stand-Off LIBS setup for ‘in-the-field’ measurements.
Chemical mapping [2] is widely used in the laboratory to detect and visualize the distribution of the desired chemical element on the sample surface. The depth profiling technique can offer, but only to a limited extent, a chemical map, even in 3 dimensions. However, for this purpose it is much more suitable to combine LIBS and computed tomography (CT). The spatial resolution of the chemical map is limited mainly by the ablation crater size. Depending on the laser energy profile and parameters of the laser focusing lens it is possible to go down to a crater size of a few micrometres in diameter.
A typical LIBS setup is shown in Figure 1. It consists of the pulsed laser source followed by the laser focusing lens to induce plasma on the sample surface, a collecting lens to collect the plasma radiation and the spectrometer with the detector to capture the plasma emission spectrum. The whole system is synchronized by the pulse generator.
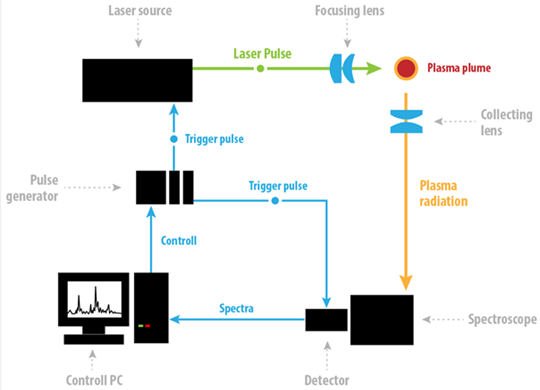
Figure 1: A typical LIBS setup
Even though the assembly of the typical LIBS setup is relatively simple, high demands are placed on the parameters of the individual components due to the special requirements of the LIBS technique. The development of LIBS and its applications is highly dependent on the progress made in the fields of pulsed lasers, spectrometers and optical radiation detectors. Pulsed lasers capable of high irradiation (> GW/cm2) on target are necessary to induce plasma on most samples. Pulse length, wavelength, energy, temporal profile, energy stability and robustness are among the most important parameters. Spectrometers of high throughput and resolution are chosen. Echelle type spectrographs deserve special attention for their simultaneous wide spectral range coverage (usually the whole LIBS range from 200 to 900 nm), whilst maintaining high resolution.
Due to the plasma emission dynamics the key parameters of the detector are the delay time before acquisition and the acquisition window time or temporal resolution. As the plasma plume evolves, the emission early in time is dominated by bright broadband light which is of little use. As the plasma expands and cools later in time, recombination and de-excitation occurs resulting in the emission of atomic emission lines which offer the key data in terms of species identification. Consequently for the best signal-to-noise (SNR), fast gating (electronic shuttering) is required to have the appropriate delay and exposure time. These are typically of a few microseconds (µs) or 100’s of nanoseconds (ns).
Other detector parameters such as high sensitivity, high quantum efficiency (QE), low dark current and high dynamic range are also of high importance.
ICCD detectors incorporating micro-channel plates (MCP) have proved to be one of the best solutions for LIBS applications, although sometimes the utilization of cheaper and more compact CCD and EMCCDs can be beneficial.
A schematic layout of the table-top LIBS setup used by the Laser Spectroscopy lab (LIBSlab) at Brno University of Technology is shown in Figure 2. It shows the main components of the system which include:
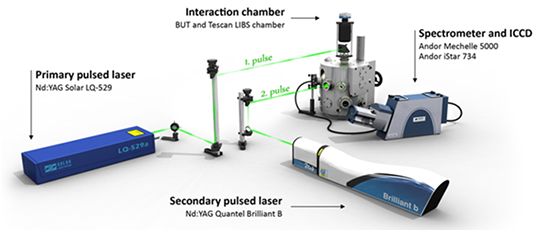
Figure 2: Main components of table-top LIBS setup at LIBSlab, Brno University of Technology
The sample chamber was designed (in collaboration between the researchers and TESCAN) [3,4] to extend the capabilities of the table-top LIBS setup to enable fast and automatic chemical mapping of samples, some as large as a few square centimetres; this typically involves the acquisition of hundreds to tens of thousands of spectra.
Their laboratory LIBS setup is capable of both Single-Pulsed and Double-Pulsed LIBS, and allows for analysis with the spectroscopic techniques of LIBS+LIFS.
Chemical mapping of elements distributed on a cut specimen of rock is shown in Figures 3. The goal was to visualize the surface distribution of elements present, such as Pt, Pb, Ni, etc, in an area of 8 × 8 mm2 on the surface of stone containing sperrylite and chalcopyrite. The spatial resolution achieved was ~ 100 µm, with the diameter of the crater ~ 50 µm and depth of the crater ~ 6 µm.
The orthogonal Double-Pulsed LIBS approach was chosen to obtain the best possible spectra achievable with a single shot measurement. The primary pulse at 532 nm had energy of 30 mJ. After a delay of 1.5 ?s the secondary pulse at wavelength 1064 nm reheated the plasma plume with pulse energy of 100 mJ. The amplifying gain of the ICCD detector was used to enhance the level of signal captured on the detector and thus provide a satisfactory signal to noise ratio (SNR).
The map was created by automated measurement of a matrix containing 6400 measurement sites or spots. Thus the map was built from the same number of spectra as there was only one spectra captured per measurement shot at each site – i.e. no accumulations were used. Thanks to the wide spectral range of the echelle spectrometer (UV-VIS-NIR) every measurement contained a trace of characteristic spectral lines of all the chemical elements present. By identifying the wavelengths of characteristic atomic emission lines one can easily set the map to visualize the distribution of any individual chemical element. Some of the spectral lines used to identify the elements here are shown at the top of each image in figure 3.
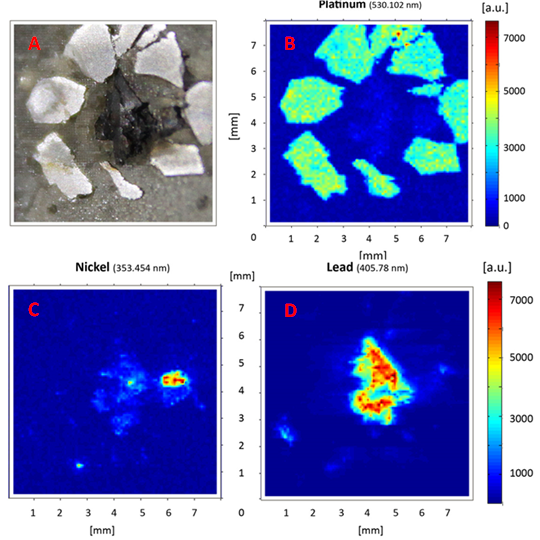
Figure 3: Chemical mapping of a cut sample containing sperrylite and chalcopyrite, (A) is image of cut sample, (B) shows distribution of platinum (Pt), (C) shows chemical map of nickel (Ni) and (D) the map of lead (Pb).
The results for similar measurements made on a sample of chalcopyrite are shown in Figure 4. The objective was to locate the galena veins running though the rock sample. Since the galena is a compound of lead and sulfur (PbS), the lead (Pb), with its atomic emission line at 405.708 nm, was used to search for the galena. The bright spots in figure 4 on the right are galena veins crossing the plane of the cut. In this particular case, a much larger area of 25 × 25 mm2 was analysed on the surface of the cut. The chemical map was built up using more than 60 000 individual spectra.
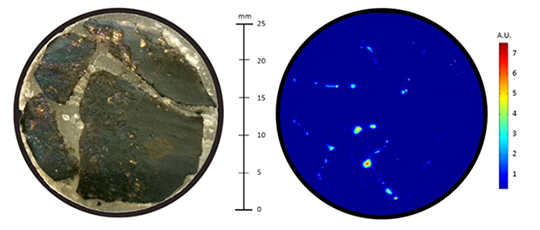
Figure 4: Chemical map of the Pb content on the surface of a cut piece of Chalcopyrite rock: a picture of the cut is shown on the left and the Pb map is on the right.
Many fields of modern material science and industry are now requiring high quality spatially resolved material analysis. The Laser Spectroscopy group at Brno have demonstrated elegantly how LIBS is able to perform this type of analysis with great success. The spatial resolution, which tends to be limited mainly by the laser crater size, can be as small as a few units of microns. LIBS is still a relatively new technique in the whole area of chemical analysis but is developing rapidly towards an accepted ‘standard’ analytic tool for a wide range of applications. Its added benefits of speed, no need for sample preparation, possibility to measure in situ and even stand-off, make LIBS a very effective tool for visualization of a chemical element distribution on the sample surface. This is well illustrated in the chemical maps of the analysed geology samples shown here.
Appreciation is gratefully extended to Dr Jan Novotný and Prof Jozef Kaiser of the Laboratory of Laser Spectroscopy, Institute of Physical Engineering, Brno University of Technology. The group’s work was funded by the Technology Agency of the Czech Republic (TACR) and the European Regional Development Fund.

© Oxford Instruments 2026
