Resources
 Part of the Oxford Instruments Group
Expand
Collapse
Part of the Oxford Instruments Group
Application Notes
Author: Dr. Tracey Clarke, University College London (UCL)
Published: 01 Aug 2025 · Last updated: 01 Aug 2025
Organic conjugated polymers have received significant attention in recent decades due to their use in several optoelectronic applications, including light-emitting diodes and solar cells.1 A crucial aspect of these conjugated polymers is the ability to tune their electronic and morphological properties through structural modification. As such, we need causal relationships between molecular structure and electronic properties. Structure-property relationships allow strategic, rational design of new materials. Of particular interest is the relationship between polymer planarity, crystallinity, and charge carrier mobility. These factors are intrinsically linked with the morphology of the polymer in the active layer.
Raman spectroscopy offers an ideal avenue for exploring the links between molecular structure and crystallinity/morphology, especially in conjugated polymers.2 Because the selection rules of Raman spectroscopy require a change in polarisability for a Raman band to have intensity, this technique is particularly suited to probing the large -systems inherent in conjugated polymers. Here, we use the resonance Raman effect to probe conjugation pathways and morphology in two conjugated polymers.3 The resonance Raman effect provides significant resonance enhancements to vibrational modes that are coupled to the electronic transition being excited. Since ground state absorption spectra of conjugated polymers are typically broad due to differing molecular environments, tuning the excitation wavelength enables regions of differing crystallinity to be probed.
Raman spectra of films and solutions were measured using a custom-made back scattering setup (Figure 1). Signals were recorded using an Andor iDus 416 CCD camera attached to an Andor Shamrock 500i spectrograph. The Raman scattering was generated via excitation with a 6 ns, 10 Hz Nd:YAG laser (Spectra-Physics, INDI-40-10). The intensity of the laser excitation was altered using neutral density filters to maintain it at 0.1 mW. The excitation wavelength was selected with a versaScan L-532 OPO (ranging from 457 to 808 nm) and the appropriate notch filters were used in front of the spectrograph slits (200 m).
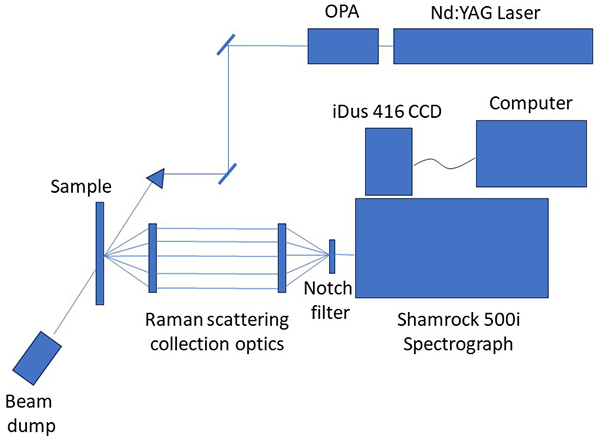
Figure 1. Schematic of the resonance Raman set-up.
The Raman spectra of the two conjugated polymers (Fig 2) were measured in both solution and film as a function of excitation wavelength. The two selenophene-based polymers differ by only a single additional bond that creates a fused, planar structure for HPPI. Unusually, however, the ground state absorption spectrum of HPPI is blue-shifted compared to the non-fused HPMI.
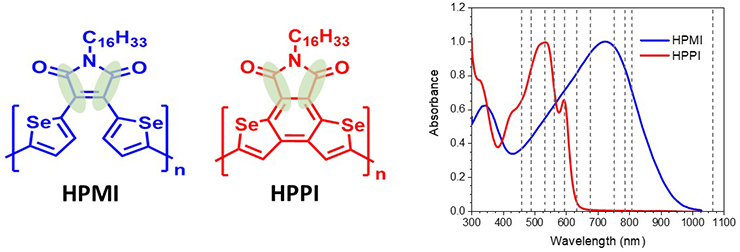
Figure 2. The structures of conjugated polymers HPMI and HPPI, where the green ovals indicate the maleimide stretching mode discussed in the text. The steady state absorption spectra of the polymers in films are also shown, where the vertical dashed lines indicate the Raman excitation wavelengths.
The Raman spectra of the two polymers are remarkably different, given the structural similarities between the two polymers, and this is attributed to different electronic structures (Figure 3). If we examine the spectral behaviour as a function of excitation wavelength, there are no large differences in the spectra for HPPI. This observation confirms a uniform polymer structure with a single resonant electronic transition. In contrast, HPMI has large changes in the Raman spectrum as the excitation wavelength is altered, implying multiple polymer environments (even in the solid phase).
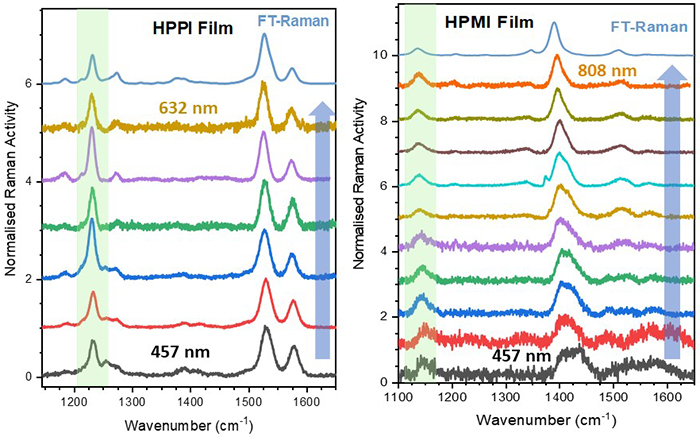
Figure 3. Resonance Raman spectra of HPPI and HPMI films, with the excitation wavelength increasing in the direction of the blue arrow. The green highlighted region shows the shifted maleimide mode.
We can use the resonance Raman spectra as a function of wavelength to construct qualitative resonance excitation profiles to gain insight into the resonant electronic transition (Figure 4). The maleimide mode at 1232 cm-1 of HPPI has relative Raman intensity enhancements that mimic the electronic absorption. This suggests that the maleimide units participate in the resonant electronic transition and therefore that the S1 excited state is mostly localised over the phenyl group and the maleimide.
Indeed, one of the primary differences between the HPPI and HPMI Raman spectra is the bands associated with the maleimide vibrational modes (Figure 3). The maleimide C-C stretch undergoes a significant upshift from HPMI (measured at 1137 cm-1) to HPPI (1232 cm-1), and this upshift is also reflected in the calculated Raman spectrum. This large upshift suggests an increased force constant of the maleimide single bond, and thus and thus considerably more double-bond character. In turn, this implies that the fusion of the selenophene rings leads to a larger contribution of the maleimide moiety in the conjugation of HPPI.
We have used this information from Raman spectroscopy, in combination with density functional theory calculations, to show that the blue-shifted absorption of HPPI is because of a truncated conjugation pathway up into the maleimide units (rather than along the polymer backbone). As such, while the fusion of the backbone has indeed planarised the backbone, the consequent distortion of the selenophene rings has disrupted the desired conjugation pathway.3
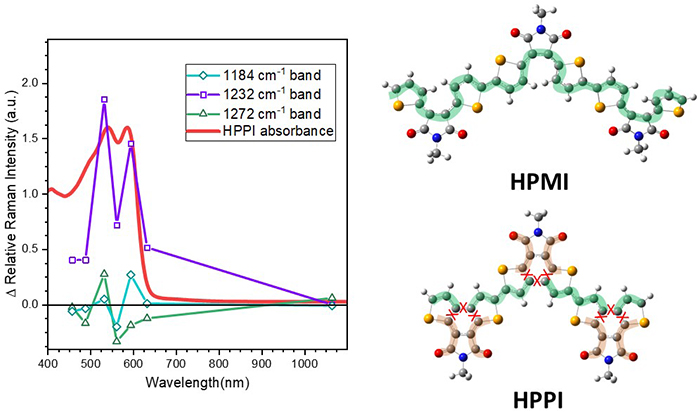
Figure 4. The resonance Raman excitation profile for HPPI, showing that the relative intensity of the maleimide mode at 1232 cm-1 mirrors the steady state absorption spectrum. This information, in addition to data from computational chemistry and infrared spectroscopy, lead to the conclusion of a truncated conjugation pathway in HPPI, as illustrated on the right.

© Oxford Instruments 2026
