Resources
 Part of the Oxford Instruments Group
Expand
Collapse
Part of the Oxford Instruments Group
Case Studies
Author: Shayne Harrel, Jean-Michel Laurent, Antoine Varagnat, Adrian Tercier & Vincent Motto-Ros
Published: 01 Sep 2023 · Last updated: 29 Sep 2023
Over the past two decades, Laser-Induced Breakdown Spectroscopy (LIBS) has rapidly emerged as a ubiquitous technique for the elemental characterization of materials. When compared to more traditional techniques of elemental analysis, such as ICP-OES/MS, Atomic Absorption Spectroscopy and spark OES, a LIBS approach offers distinct advantages - it can be rapid, field-deployable and requires minimal sample preparation. As a result, LIBS applications have included detection of toxic metals in environmental samples, characterizing elemental concentrations in geological samples, remote detection of explosives, chemical and biological warfare agents, and analysis of combustion processes. More recent work has involved the use of LIBS in biological imaging and demonstrating its capability of tracking the distribution of nanoparticles in biological organs1-3.
The latest generation of fast-gated cameras based on scientific CMOS (sCMOS) sensor technology provide high acquisition rates and simultaneous high dynamic range compared to CCD, Interline or EMCCD-based gated detectors. Gated intensified sCMOS technology enables the development of novel approaches to fast spectroscopy. In this example, we look at micro Laser-Induced Breakdown Spectroscopy (µLIBS) imaging. We present examples of advanced LIBS imaging enabled by this gated sCMOS technology and latest generation of ultra-stable kilohertz Q-switch diode lasers. We have achieved spatial resolution down to 10 µm by incorporating an automated XYZ translation stage. Here we discuss the timing diagrams and triggering schemes for the translation stage and intensified camera. We present LIBS images with up to 4K definition (3840x2160 pixels), obtained in less than 5 hours. Such results show the spatially resolved elemental distributions of Si, Fe, Cu, Al, Mg, Ca and Ag for several geological samples. This demonstrates the high throughput potential of this approach and a great reduction of experimental time, while preserving chemical information integrity.
Figure 1 schematically illustrates the LIBS process4. A nanosecond pulsed laser is focused onto a sample where it absorbed (a). The energy transfer from the laser pulse to the sample creates a 10 µm sized crater in the material on the nanosecond timescale and the sample is vaporised, melted, sublimised and atomised (b). A few hundred nanoseconds after excitation, the sample emits a continuum of radiation as well as generating a shockwave, a plasma and Bremsstrahlung (or braking) radiation (c). Around 1 µs after excitation, the plasma begins to cool, and the sample emits radiation that carries a specific optical fingerprint which is used to determine elemental identity. The intensity of the radiation can be correlated to elemental concentration (d). Due to the timescale of this process, gated detectors are used to isolate the LIBS signal evolving on the µs timescale from radiation emitted due to processes occurring on earlier, sub-µs times.
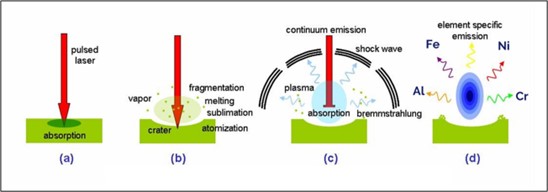
Figure 1. Schematic of the laser-induced breakdown process. Figure modified from Reference 3.
There are several technical challenges that must be considered when constructing a LIBS imaging platform -
sCMOS detectors were developed in 2009 as an alternative 2D detector to charged coupled devices (CCDs)5,6. The design of both detector technologies is shown in Figure 2. Unlike CCDs or electron multiplied CCDs (EMCCDs), where charge collected and transferred from individual pixels into a readout register, sCMOS detectors are constructed such that each individual pixel has its own array of electronics to convert photoelectron charges to voltage, enabling entire rows of pixels to be readout simultaneously, resulting in rapid frame rates. Furthermore, while the read noise on CCDs and EMCCDs increases with increasing readout rate (or frame rate), read noise on a sCMOS remains low at rapid readout rates.
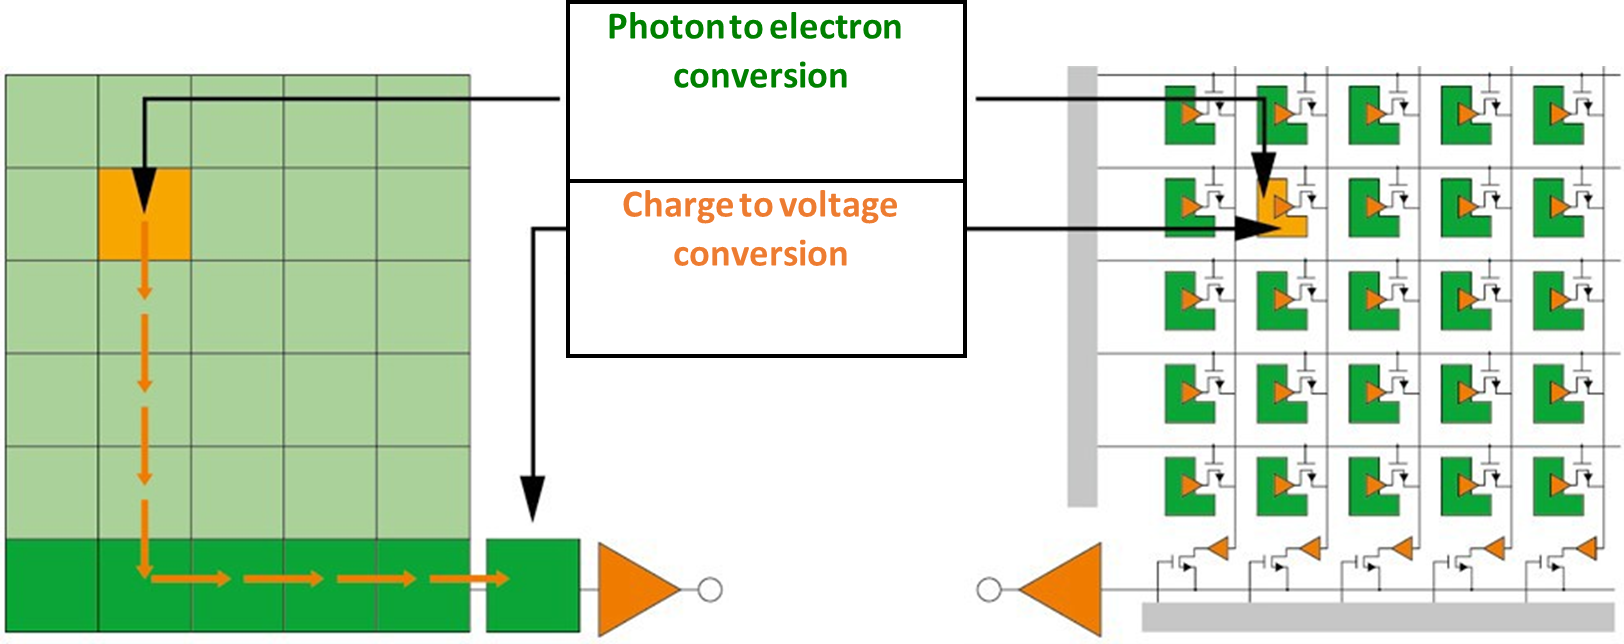
Figure 2. Diagram showing the pixel layout and design of a CCD sensor (left) and a sCMOS sensor (right).
We can attempt to overcome the higher read noise at high readout rates on EMCCDs by increasing the gain on the detector to amplify the signal. Also for an intensified CCD (ICCD) this is often done by increasing the gain on the Micro Channel Plate (MCP). Or we can use an emICCD which combines both. However, while this approach does reduce the read noise to negligible levels, high gain severely limits the dynamic range. This reduction in dynamic range at high readout rates is far less pronounced in gated intensified sCMOS detectors, because very little gain is required to reduce the effect of the inherently low read noise on the signal to noise ratio.
Table 1 lists typical read noise, gain required to overcome the read noise floor, pixel well depth, and resulting dynamic range for three camera types. Due to the low read noise at maximum full frame readout rates, the dynamic range of a gated intensified sCMOS detector is ~5 times greater than an emICCD and ~12 times greater than an ICCD. This combination of sub µs time-resolution and low read noise while maintaining high dynamic range at high readout speeds make gated intensified sCMOS detectors ideal for fast, high contrast LIBS imaging experiments.
Table1. Pixel read noise, gain settings, pixel well depth and resulting dynamic range of CCD-based gated intensified detectors compared to sCMOS based platforms operating at lower MCP gain.
| Gated Intensified sCMOS (13 µm pix.) | 1 MP Interline ICCD (12.8 µm pix.) | 1 MP emICCD (13 µm pix.) | |
| Pixel read noise (full frame max. rate) | 5.2 e- | 70 e- | 90 e- |
| Gain to overcome sensor noise floor | ~ X31 | ~ X420 | ~ X540* * dual MCP and EM gain |
| Pixel well depth | 120,000 e- | 130,000 e- | 400,000 e-(register pixel) |
| Dynamic range | ~ 3870:1 | ~ 310:1 | ~ 740:1 |
Figure 4 shows the LIBS imaging experimental setup. A sample is placed on a XYZ translation stage where it is excited by a Q-switched laser producing nanosecond pulses centred at 1064.2 nm, 500 µJ/pulse, at a 1 kHz repetition rate (Cobolt TorTM XE, HUBNER Photonics GmbH, Germany). LIBS emission is coupled into an optical fibre and sent to a Czerny-Turner spectrograph (Kymera 328i, Andor Technology) dispersed, and focused onto a gated intensified sCMOS detector (iStar sCMOS, Andor Technology). 1V amplitude pulses of 50 µs duration, separated by 1 ms are used to trigger the laser. This in turn, triggers the gating on the iStar sCMOS detector with 5 µs pulses, separated by 1 ms and offset from the original trigger pulse by 180 µs. Single-shot LIBS spectra, spatially resolved to 10 µm, are obtained with the use of computer controlled XYZ translation stage operating in raster scan mode, are collected at a rate of 1 ms/point. LIBS spectra are analysed to extract elemental identities and their concentrations, then combined to construct an image revealing the multi-elemental concentrations of the sample.
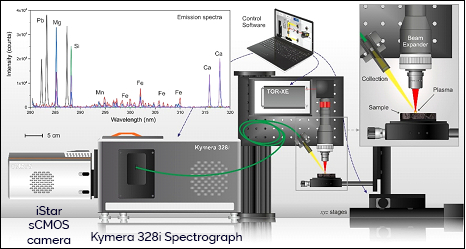
Figure 4. LIBS imaging experimental setup and example single shot spectrum.
We have studied a sample containing various mineral phases such as pyrite, chalcopyrite, carbonates and silicates in order to demonstrate the analytical capability of LIBS imaging applied to the characterisation of rocks. The elemental images obtained for silicon (Si), iron (Fe), copper (Cu), aluminium (Al), magnesium (Mg), calcium (Ca), and silver (Ag) are shown in Figure 5.
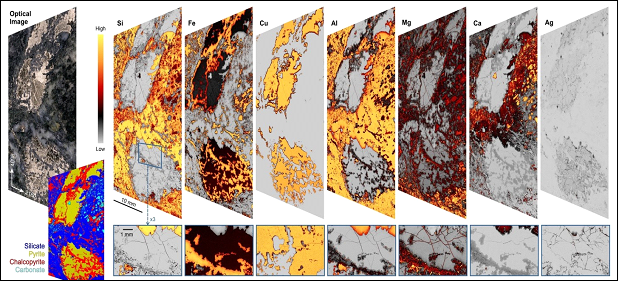
Figure 5. 4K LIBS image of a geological sample showing elemental distributions of Si, Cu, Fe, Mg, Ca, and Ag (1 ms/point), resolution: 10 µm.
Note that two consecutive scans were performed to cover the spectral range from 260 to 340 nm. The surface covered corresponds to 8.85 cm² (Fig 5) and the step size was 10 µm. Approximately 8.85 million of LIBS spectra x2 (i.e. 2 scans) were collected at a laser frequency of 1 kHz, and further post-processed to reconstruct such high-definition elemental maps. The total duration of the experiments was less than 5 hours. The resolution of each elemental image is 4096 by 2160 pixels, nearly approaching the 4K high-definition image standard. From the elemental images we have evaluated the different mineral phases present in the sample (Silicate, Pyrite, Chalcopyrite, Carbonate) as illustrated in Fig. 5. The great advantage of using kHz LIBS for elemental imaging of rocks with such definition (quality including the spatial resolution, large-probed surface, and high dynamic range in intensity) is to reveal the presence of certain strategic elements such as Ag, Au, Pt, Co that are of great interest in the mining industry with typical localization in small grains (not visible in figure 5) while revealing the entire mineral structure of the sample.
This is a new setup for high-speed, high-resolution LIBS imaging making use of the latest generation of fast-gated sCMOS cameras and ultra-stable kilohertz Q-switch diode lasers. 4K LIBS images, revealing the multi-elemental composition of a sample, can be obtained on sized samples with 10 µm spatial resolution in less than 5 hours, without sacrificing chemical information integrity. This high-throughput and highly accurate approach enhances the applicability of LIBS imaging as a technique for multidimensional elemental mapping for sample types ranging from geological to biological.
We gratefully acknowledge the data provided from Vincent Motto-Ros and his group at the ILM in Lyon, France used in this communication.
The authors would like to thank: C. Dujardin, S. Hermelin (UCBL, Optolyse), Florian Trichard (Ablatom SAS), Cecile Fabre (GeoRessources), and Elena Vasileva (Hubner photonics) for their help and support.
Article by Shayne Harrel, Jean-Michel Laurent, Antoine Varagnat, Adrian Tercier, Vincent Motto-Ros (Andor Technology, Belfast, UK, and Institut Lumiere Matiere, Univ. Lyon France)

© Oxford Instruments 2026
