Resources
 Part of the Oxford Instruments Group
Expand
Collapse
 Part of the Oxford Instruments Group
In the literature there is only little information on the luminescence of organic solar cells, since only few work groups own a spectroscopy setup that is capable of recording this near-infrared luminescence. Such measurements are much more common in work groups studying organic light emitting diodes; however, they predominantly measure in the visible part of the spectrum with relatively high luminescence intensities.
When novel materials such as e.g. polymers are used in the photoactive layer of organic solar cells one often does not find any spectral information on their luminescence. Spectroscopic measurements are however inevitable when, for example, luminescence imaging measurements of such novel devices are performed, as otherwise the results cannot be properly understood.
Our group chose the Andor Shamrock spectrograph SR-193i-B2 in combination with the Andor iDus InGaAs 1.7 µm photodiode array (DU490A-1.7) since they fulfilled our requirements excellently, additionally with the incentive that the costs were much lower than for comparable equipment from competitors. Furthermore, many integrated supplementary functions offered by different competitors had no value for us. On the other hand, the simple and integrated thermo-electrical cooling of the photodiode array was a necessary prerequisite for us.
An initial implementation of the setup was performed with technical support from LOT-QuantumDesign; a simple test measurement could be performed on the same afternoon with an improvisational sample holder and optical lenses in order to couple the luminescence light into the spectrometer. The permanent implementation on the optical table was possible without any problems since the feet of the spectrograph are compatible with post holder clamps provided by Thorlabs. The installation of the measurement software on the computer in the lab as well as the connections to the spectrometer worked very smoothly.
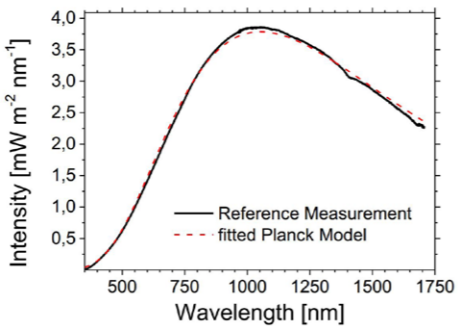
The coupling of luminescence light from a self-made sample holder into the spectrograph was implemented on an optical rail. The optimization of the signal intensity was our main concern. This optimization was performed using a test sample which generates visible light. This sample was relayed onto the entrance slit of the spectrograph by means of optical components. The relative intensity calibration of the setup was performed using an underpower tungsten light bulb. The used reference spectrum is shown in Figure 1.
So far, the resulting correction function is only manually included in the results, since we regularly exchange optical components in the beam path. Integration into the software seems possible; however, due to the regular variation of the correction function it is more feasible for us to record it once before each usage in each configuration.

Figure 1: Reference spectrum of the tungsten light bulb.
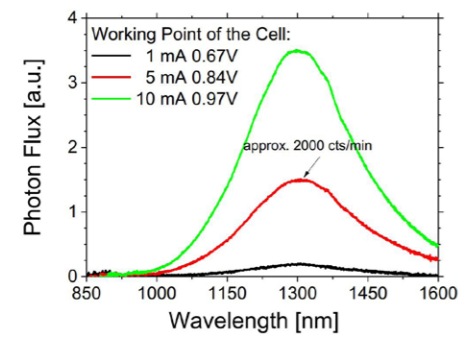
With the described configuration it is possible to perform simple electroluminescence spectroscopy measurements with integration times of approximately one minute. A calibrated example measurement of a P3HT:PCBM standard solar cell is shown in Figure 2. It is important to note that the luminescence signal originating from the solar cell is much weaker than the accumulated background signal of the InGaAs photodiode array. Since this background is accumulated systematically it can be measured separately with a closed shutter and subtracted from the measurement with open shutter. This background signal is generated by the high dark current of the InGaAs sensor, due to its smaller band gap compared to other semiconductors such as e.g. silicon. This dark current is mainly determined by the temperature of the detector array, but also by the black body radiation from the environment (i.e. the inside of the spectrograph).

Figure 2: Relative intensity calibrated electroluminescence measurement from a P3HT:PCBM solar cell at different working points.
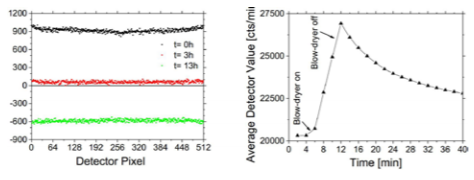
However, what we had not anticipated is the high portion of the background signal that originates from the black body radiation of the environment. In Figure 3(a) the deviation of the background signal to a reference background is shown at different times. The deviation correlated with the temperature profile of one night. This temperature dependence of the background signal is shown in Figure 3(b), where the spectrograph casing on the opposite side of the detector array is heated with a blow-dryer by approximately 4 K. Note that the temperature of the detector array remained constant during this process. One can observe that the variation of the background signal is much stronger than the (small) intensity of the solar cell signal that we intend to measure. Because of this drifting background some measurements, especially measurement series over longer periods of time, have not been possible yet. Apart from room temperature, this temperature variation is caused by the cooling of the photodiode array as well. Although its heat is dissipated by a water cooling system, the whole casing heats up by approximately 3 K after activation over a period of 2 hours. In order to perform measurement series over longer periods of time we implemented an insulation of the spectrograph casing combined with active temperature stabilization using EuroTherm temperature controllers.

Figure 3: (a) Background deviation with a closed shutter at different points in time, (b) Average detector value when the casing temperature is elevated by approximately 4 K using a blow-dryer. In both subfigures the sensor array temperature remained constant at -70 °C.
With the Shamrock SR-193i-B2 and the iDus InGaAs DU490A-1.7 photodiode array we have implemented a spectroscopy setup which performs to our full satisfaction. The necessary modifications were unexpected although being possible with moderate effort. The obtained results show a better signal-to-noise ratio as most published results in this research field. It can be expected that this spectroscopy setup will play an important role in the future scientific research of our group.
A detailed description of the setup (without active cooling) as well as additional results can be found in the thesis [1] written by Yvonne Jeneke Reinhardt.
[1] Yvonne Jeneke Reinhardt; Imaging and Thin-Film Optics of Organic Solar Cells; Dissertation; Faculty of Mathematics and Physics; Albert-Ludw
Date: June 2016
Author: Dr. Uli Wuerfel, Head of Department Dye and Organic Solar Cells, Division Solar Cells-Development and Characterization, Fraunhofer Institute for Solar Energy Systems (ISE)
Category: Application Note
