Resources
 Part of the Oxford Instruments Group
Expand
Collapse
Part of the Oxford Instruments Group
Application Notes
Author: M. Allgaier, V. Ansari, L. Sansoni, V. Quiring, R. Ricken, H. Suche, B. Brecht, C. Silberhorn, Integrated Quantum Optics Group, Department of Physics, University of Paderborn
Published: 01 Feb 2016 · Last updated: 28 May 2026
Tags: nl-spectroscopy-app
Introduction
In this work, we spectrally characterize a Type-I sumfrequency generation in Titanium-indiffused waveguides in periodically poled Lithium Niobate (Ti:ppLN). We discuss features of the phase matching curve that indicate the optimal experimental conditions to run the process with single photons from a parametric down conversion (PDC) source at roughly 1536 nm. With the pump wavelength at 874 nm the idler appears at 557 nm in the green. We present spectral properties of the idler at the single photon level.
In recent research on quantum communication, parametric down-conversion (PDC) in χ(²) -nonlinear crystals plays a major role for the generation of photon pairs (see e.g. [1, 2, 3]). If the source is engineered in a way that gives control of spectral properties of the process [4], a rich temporal-spectral structure can be exploited for quantum communication [5]. However, these so called temporal or time-frequency modes arising from the Schmidt-mode decomposition of the PDC state have to be controlled.
The temporal and spectral structure of the photons can be accessed and manipulated via the quantum pulse gate (QPG, [6]). This engineered, nonlinear device employs a group-velocity matched sum-frequency generation process to operate on the temporal mode structure of PDC photons. Moreover, as the process converts telecom photons to the visible spectrum, detection is simplified. This process is especially efficient due to the high confinement in Titanium-indiffused waveguides in periodically poled Lithium Niobate where group-velocity matching between signal and pump guarantees a long interaction length of several centimeters. The constant temporal overlap is crucial to enable operation on the aforementioned temporal modes. Furthermore, the QPG offers the side effect of bandwidth compression that might actually prove to be quite useful in the context of interfacing flying qubits with atomic transition of quantum memories [7, 8].
Sum-frequency generation (SFG)
Sum-frequency generation is a second order nonlinear process where a pump (p) field and an input field labeled signal (s) overlap and the signal is, in the ideal case, completely converted to the idler (i) wavelength, where the idler frequency ωi = 2πc/λi is the sum of the pump and signal frequencies:

This is equivalent to conservation of energy. Similarly conservation of momentum gives rise to the phase matching condition:

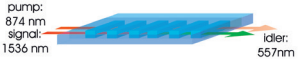
Figure 1: Sketch of the Ti:ppLN waveguide used for the sum-frequency generation
In bulk materials this condition gives rise to constraints on the angle between the beams. However, we employ waveguides for the process which forces the fields to be coaxial. This implies that the wave vectors can be replaced by a scalar propagation constant

where neff describes the effective refractive index associated with the propagation speed of the spatial mode. With dependencies on the wavelength we encounter a phase mismatch:

To compensate for this, a common technique called periodic poling is typically employed. The controlled inversion of the spontaneous polarization of the crystallographic domains introduces an additional grating vector kG defined by the poling period Λ:

Where m is an odd integer and describes the order of the quasi-phase matching . Thus the phase mismatch ?k can be compensated and an arbitrary wavelength combination for the sum-frequency generation, within the limits of poling technology of course, can be achieved. Moreover, temperature dependence of the refractive index offers an additional degree of freedom for fine tuning the phase matching . It has to be noted that in the experiment phase matching for more than one wavelength combination at the same time is possible. This is due to the fact that the waveguides support only a single mode for the signal wavelength of 1536 nm, but several spatial modes exist for the pump and idler wavelength, enabling quasi phase matching for several combinations of signal and pump wavelength.
Engineering group-velocity matching
The SFG process used in the experiment is a type-II process, meaning pump and signal possess orthogonal polarization. This implies that their group velocities are different not only due to dispersion but also on account of the birefringence of Lithium Niobate. The group velocities of Lithium Niobate for polarization along the ordinary and extraordinary axis are shown in figure 2. For signal and pump a wavelength combination as indicated is chosen to achieve group velocity matching between the two inputs. The grating period for the periodic poling is then chosen according to equations and so that quasi-phase matching is achieved for that wavelength combination. This allows for the two inputs to keep their overlap as they travel along the waveguide. For the case treated here a short grating period of 4 micrometers is necessary. The long interaction length gives rise to the high conversion efficiency of the process that can be as high as 87.7% [6]. Such high conversion efficiencies are only possible with properly designed phase matching and excessive knowledge thereof. It is noteworthy that the group velocity of the idler is different from the others:

To be exact, this group velocity mismatch leads to a much longer pulse duration of the idler in comparison to the signal: Idler pulse duration is of the order of 20 ps, while the signal and pump durations are equally short at under 1 ps. As the spectral shape of the pulse is the Fourier transform of its temporal envelope, the bandwidth of the idler is in the range of tens of picometers, which makes a high resolution spectrometer indispensable for the characterization of the process.
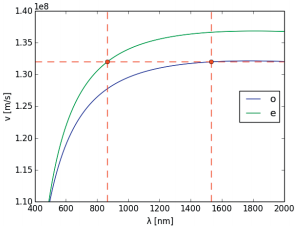
Figure 2: Group velocities for ordinary (o) and extraordinary (e) polarization in Lithium Niobate. Dashed lines indicate an exemplary wavelength combination for a group velocity matched SFG process
Phase matching characterization
For the measurement of the phase matching we use the setup depicted in figure 3 which contains a pulsed Ti:Sapphire laser (Coherent Chameleon Ultra) operating around 874 nm and a tunable continuous wave (CW) fiber-laser (Tunics) emitting around 1550 nm. The fiber laser, which acts as signal, is swept while the emission wavelength of the pulsed laser acting as pump is kept constant. The small linewidth of the CW laser in comparison to its pulsed counterpart allows a very fine sampling of the phase matching . Half wave plates set the orthogonal polarizations required for the type-II process.
Precise coupling through aspheric lenses to the QPG waveguide is controlled via a Elliot-Martock Waveguide Workstation offering a total of 10 degrees of freedom. The coupling is aligned in a way so that the pump is in the fundamental spatial mode when the output in imaged onto a CCD camera. The idler is then separated from unconverted light and residual pump by a dichroic mirror and coupled into a multimode fiber. The fiber is connected to an Andor spectrometer system consisting of a Shamrock SR-500i-D1-SIL spectrograph and Newton DU970P-BVF EMCCD camera. With automatizing laser tuning and acquisition of measured idler spectra a joint spectral intensity measurement of the SFG process as shown in figure 4 can be obtained.
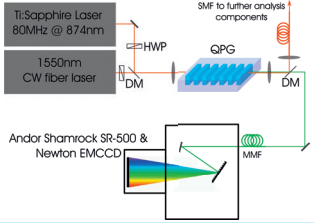
Figure 3: Experimental setup for phase matching characterization; HWP: Half wave plate, DM: Dichroic mirror, SMF: Single mode fiber, MMF: Multimode fiber
The plot reveals several features of the process. First, several spatial modes can be observed. Even though the majority of the pump power is in the fundamental mode associated with the bright trace at the bottom of the image, there is some residual power in other spatial modes leading to two more traces peaks in the middle of the image.
Furthermore, each of the phase matching curves associated with the modes has a curvature. The angle is given by the group-velocity mismatch between signal and pump where the horizontal point indicates perfect group velocity matching, which is the case at the top of the curves shown here
Finally, the sinc-shape of the phase matching is visible for the brightest of the traces. It is noteworthy that the spectral width of the detected idler spectrum is only about 30 pm while the entire modal structure observed has a width of less than 2 nm. Observing details of that structure is only possible with the installed diffraction grating with 2400 lines/mm. At the available brightness level of the two lasers the electron multiplier of the Andor Newton camera can be turned off while still achieving acquisition time for each spectrum (the image shown consists of 100 spectra) in the range of 100 ms.
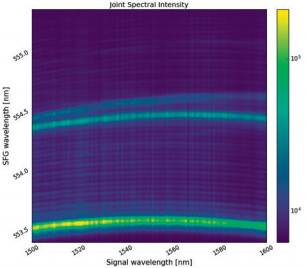
Figure 4: Joint spectral intensity of the SFG process
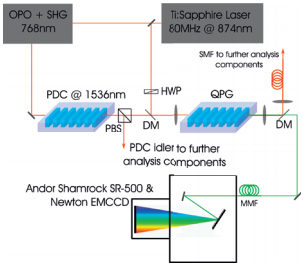
Figure 5: Experimental setup for frequency conversion of photons from a PDC source; HWP: Half wave plate, PBS: Polarizing beam splitter, DM: Dichroic mirror, SMF: Single mode fiber, MMF: Multimode fiber
SFG operation with PDC photons
In the next experiment one of the phase matching conditions associated with one spatial mode is chosen according to the emission wavelength of 1536 nm of a waveguide PDC source based on periodically poled Potassium Titanyle Phosphate (KTP) [4]. The source is pumped by 768 nm pulses obtained by downconverting the pulses from the laser using an APE compact OPO and a bulk SHG crystal. In the setup depicted in figure 5 the photons from a degenerate type-II process are split up by a polarizing beam splitter and one of them is sent to the QPG. The source is pumped so that the mean photon number of the PDC state is about 0.1
To observe the faint converted green photons from the SFG process, we take advantage of the exceptionally high quantum efficiency of the EMCCD camera. An obtained spectrum is depicted in figure 6 where one can still observe the peaks arising from different spatial modes. The acquisition time was in the range of a few seconds, however, the electron multiplier allows to lower the acquisition time as low as 300 ms which allows for real time view of the converted spectrum and is suitable even for alignment. The short acquisition time basically presents a real time measurement that allows further alignment of the waveguide coupling with the single photon signal.
Conclusion
We characterized the phase matching function of a wave guided type-II sum-frequency generation process in Titanium-indiffused Lithium Niobate with a high resolution spectrometer and were able to observe the mode structure of this measured function. This enabled us to identify conditions for group velocity matching between signal and pump, which finally allowed efficient frequency conversion of single photons from a Potassium Titanyle Phosphase based Parametric Down conversion source observable in real time. Identifying the conditions which make the process group velocity matched enable a range of applications sensitive to temporal overlap such as operation on time-frequency modes [5, 6].
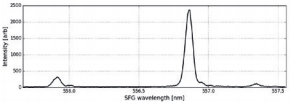
Figure 6: Spectrum of frequency upconverted PDC photons
References

© Oxford Instruments 2026
