Resources
 Part of the Oxford Instruments Group
Expand
Collapse
Part of the Oxford Instruments Group
Application Notes
Author: Dobromił Respekta, Bega Karadza, Pieter Schiettecatte, Hannes Van Avermaet, Leila Mingabudinova, Luca Giordano, Yu-Hao Deng, Igor Nakonechnyi, Kim De Nolf, Willem Walravens, Youri Meuret, and Zeger Hens*
Published: 01 Aug 2025 · Last updated: 21 Aug 2025
Solid-state light-emitting diodes (LEDs) emit nearly monochromatic light, yet seamless tuning of emission color throughout the visible region remains elusive. Color-converting powder phosphors are therefore used for making LEDs with a bespoke emission spectrum, yet broad emission lines and low absorption coefficients compromise the formation of small-footprint monochromatic LEDs. Color conversion by quantum dots (QDs) can address these issues, but high-performance monochromatic LEDs made using QDs free of restricted, hazardous elements remain to be demonstrated. Here, we show green, amber, and red LEDs formed using InP-based QDs as on-chip color convertor for blue LEDs. Implementing QDs with near-unity photoluminescence efficiency yields a color conversion efficiency over 50% with little intensity roll-off and nearly complete blue light rejection. Moreover, as the conversion efficiency is mostly limited by package losses, we conclude that on-chip color conversion using InP-based QDs can provide spectrum-on-demand LEDs. To form color convertor layers, these QDs were dispersed in a photocurable thiol–ene resin consisting of pentaerythritol tetrakis(3-mercaptopropionate) (PETMP). We found that the incorporation of the QDs in such a cross-linked resin significantly enhanced the photostability of the QDs in ambient, while inducing a considerable redshift of the emission in the QD-in-resin composites used for on-chip color conversion. On the other hand, we observed no shift of the absorption line of the same composites, while also the emission line of dilute QD-in-resin composites stayed put. We therefore assigned the redshift in the actual QD-in-resin composites used for on-chip color conversion to self-absorption of the emitted light.1
In order to asses this self-absorption, we have measured spectrally dependant, time-resolved photoluminescence of the QDs in solution and QD-in-resin composites. For this experiment we used 80 MHz at 800 nm laser, that was pulse picked and frequency doubled to obtain 1 MHz at 400 nm, that was used to excite the samples. The emitted light from the QDs was coupled into the Andor Shamrock 750i spectrometer, that was used to spectrally filter the emitted light, that is then coupled into the optical fiber connected to time-correlated single photon counting system, see Figure 1.
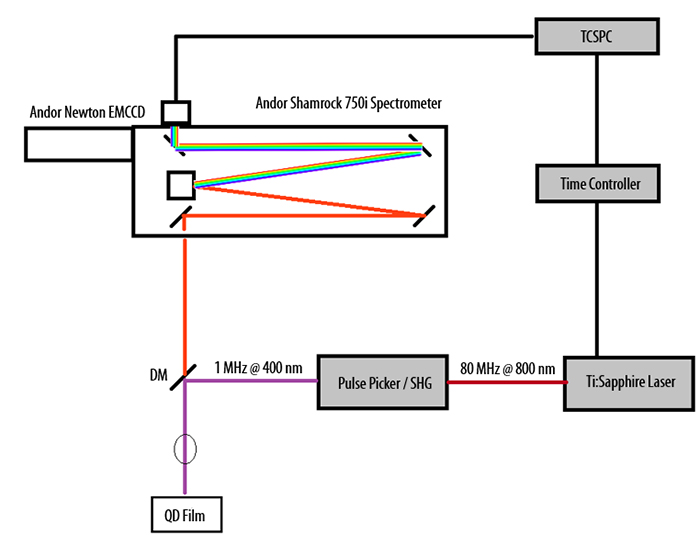
Figure 1. Schematic drawing of the time-resolved photoluminescence set-up combining ultrafast laser with Andor Shamrock 750i spectrometer and time-correlated single photon counting.
Figure 2 displays the photoluminescence decay as measured on red emitting InP/ZnSe/ZnS QDs as measured on the initial colloidal dispersion and the final high-loading resin. In the case of the dispersion, the emission spectrum features a minor redshift as a function of time. More specifically, after 20 ns, the peak emission intensity has shifted by 1.5 nm. This shift reflects the increase of the radiative recombination rate of QDs with a large band- edge transition. More precisely, the average recombination rate as estimated from a three-exponential fit to the decay trace increases from 0.035 to 0.037 ns⁻¹ for emission at 605 and 585 nm, respectively, a change that agrees well with the predicted ω² scaling of the emission rate. For the QD-in-resin, the emission exhibits a more pronounced redshift as a function of time – from 609 to 615.5 after 20 ns – which comes with an additional acceleration of the emission at the blue side of the spectrum and some delay of the emission at the red side of the spectrum. Both features point towards the transfer of energy from the fraction of QDs with the larger band gap to the fraction of QDs with the smaller band gap in the ensemble. To estimate the energy transfer rate, we start from the notion that the emission of the central fraction will feature no net effect from energy transfer, as the influx of excitation from the blue side of the ensemble will balance the loss of excitation to the red side of the ensemble. The corresponding average recombination rate at this wavelength amounts to 0.0425 ns⁻¹, where the increase with respect to the dispersion could reflect the higher refractive index of the surrounding matrix. Using this number, the average recombination rate at the blue side of the emission line can be estimated as 0.045 ns⁻¹, where we use the same ω² scaling as determined for the emission rate in dispersion. Given the effective luminescent emission rate of 0.057 ns⁻¹, we estimate the energy transfer rate at the blue side of the emission band at 0.012 ns⁻¹, i.e., about one quarter of the radiative rate.
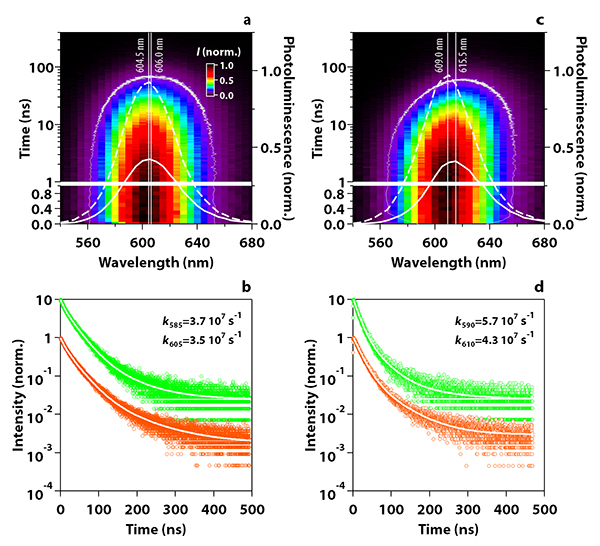
Figure 2. Transient photoluminescence of InP/ZnSe/ZnS QDs in dispersion and resins. (a) Wavelength-time map of the photoluminescence of InP/ZnSe/ZnS QDs dispersed in toluene after photo-excitation with 400 nm light. The dashed and full white lines represent the emission spectrum after 1 and 20 ns, respectively, while the grey line is the emission intensity contour at Iₙₒᵣₘ = 0.1. (b) Photoluminescence transients at 605 and 585 nm, together with a best fit using a triple exponential that was used to determine the average photoluminescent lifetime. (c–d) The same for InP/ZnSe/ZnS QDs dispersed at high loading in the thiol-ene resin used for this work. In this case, transients at 610 and 590 nm are shown. Adapted from Ref. 1.

© Oxford Instruments 2026
