Resources
 Part of the Oxford Instruments Group
Expand
Collapse
Part of the Oxford Instruments Group
Application Notes
Author: February 2011
Published: 10 Feb 2021 · Last updated: 28 May 2026
State-of-the-art 3rd generation synchrotron sources such as the Swiss Light Source (SLS) or PETRA III in Hamburg offer the possibility to focus a large amount of monochromatic photons into spots of less than a micron in size. This makes them good tools for investigating crystallographic structures. However, for these micro- and nano-beam experiments the effect of radiation damage is a severe limitation for the quality of obtainable X-ray data, especially in the case of biological molecules [1, 3, and 4]. The problem of radiation damage also applies with the use of neutrons and electrons as the illumination source. This short application note describes a setup used by a group at the DESY synchrotron facility in Hamburg [2], using in-situ Raman spectroscopy with an Andor Shamrock and Newton CCD camera, to assess the induced radiation damage induced in biological samples.
Introduction
Radiation damage is often divided into two categories:
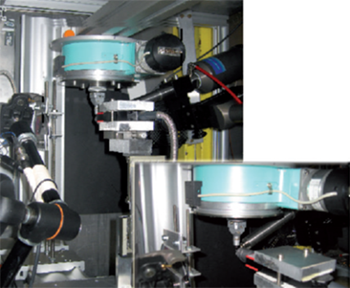
Figure 1: Schematic of the experimental setup used at the beamline. (Note the spectrometer and detector are not shown).
Thus the effects of X-ray damage range from small alterations of specific bonds up to a complete destruction of the overall crystal structure. One possibility to reduce radiation damage is cooling the samples to cryogenic temperatures during data collection. However, the lifetime of a crystal is limited even at 100 K. For further reduction of radiation damage the underlying processes have to be understood in more detail.
One possible explanation for specific radiation damage is X-ray induced hydrogen abstraction from the organic molecule [3]. In the case of L-serine this is thought to occur at the methylene side. The group at DESY used a combination of Raman spectroscopy with X-ray diffraction techniques to detect the cleavage of such bonds.
Experimental Setup
White beam irradiations were performed at 300 K at F4 at DORIS III in Hamburg. A Shamrock spectrograph (SR-500i-A) and the Newton CCD detector (DU940N-BV) from Andor Technology were installed at the beamline for the in-situ Raman measurements. The spectrograph was spectrally-calibrated in advance using a Hg-lamp. The spectrograph and camera were controlled with the Andor Solis software for Windows. Figure 1 shows a picture of the experimental setup on the beamline.
A Raman probe (Enwave Optronics) was used to take the Raman measurements. A single mode fibre was connected to the excitation source which was a 532 nm CW laser. The output power at the probe end was measured to be ~40 mW. A second fibre was used to collect and guide the Raman scattered signal into the spectrometer. The alignment of fibre was optimised prior to the experiment to ensure the maximum signal throughput. The crystalline sample was placed in the X-ray beam and the Raman probe was aligned at a 90° angle with the incident beam. All optical elements were protected from X-ray irradiation with lead cover plates.
Results and Discussion
Figure 2 shows Raman spectra of a crystalline sample. A reference spectrum for the un-irradiated L-serine (dark blue curve) is shown at the bottom. This spectrum was acquired using a 300 l/mm grating and with an exposure time of 60 seconds. Using an 1800 l/mm grating, the spectrometer was set to monitor the suspected Raman signal associated with the CH2 bonding. Whilst the sample was exposed to X-ray irradiation, a kinetic data series was acquired of 60 spectra with an exposure time of 60 seconds/spectrum. After several runs a significant fluorescence signal was emitted due to X-ray induced colouring of the crystal. This fluorescence interfered with the Raman signal making further measurements more difficult.
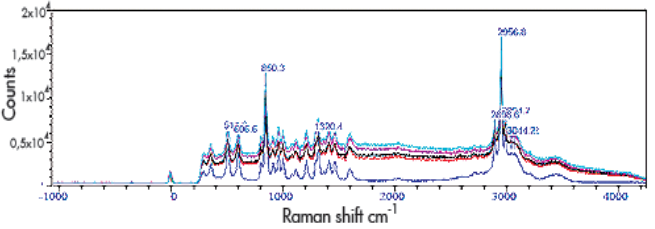
Figure 2: Spectra of L-serine after different exposure times: blue (bottom curve) is with no irradiation, red (next curve up) is with 10560 seconds, black with 11160 seconds, pink with 11760 seconds, and turquoise with 13560 seconds.
The conclusion then drawn was the need for further measurements to be performed at different Raman excitation wavelengths, where fluorescence is less of a problem, to ensure the reliability of their initial results.
Conclusion
The group demonstrated the feasibility of their experimental approach to this application which required an efficient high throughput spectrograph with a high-sensitivity, high-resolution CCD detector. Moreover, the Solis software provided a user friendly interface which enabled relatively easy real-time data collection. The DU940N-BV CCD detector, combined with the range of possible gratings for the SR-500i spectrograph, resulted in a high resolution and versatile setup. The system proved itself an excellent tool for in-situ Raman measurements during X-ray experiments.
Acknowledgment
This information and figures for this note have been gratefully received from Dr D Heintz at the Hasylab, Deutsches Elektronensynchrotron (DESY), Hamburg, Germany.
References

© Oxford Instruments 2026
