Resources
 Part of the Oxford Instruments Group
Expand
Collapse
Part of the Oxford Instruments Group
Application Notes
Author: Michael D. Lesoine, Emily A. Smith, The Ames Laboratory
Published: 01 Jul 2020 · Last updated: 28 May 2026
Raman microscopy is used in the fields of life sciences, pharmaceuticals, geology and mineralogy, and the semiconductor industry, to name a few. A conventional dispersive Raman microscope consists of a laser, microscope-based sample cell, spectrometer, detector, and optics. Figure 1 shows an instrument layout where the laser is focused onto the sample with a microscope objective and the Raman scattering is collected in the epi-direction through the same objective. (Caution: The laser should be blocked from entering the microscope eyepiece for user safety.)
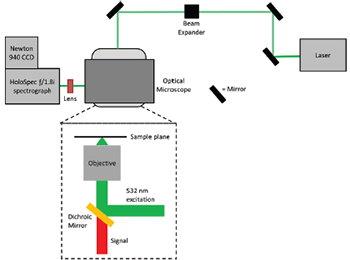
Figure 1: Instrument schematic for conventional Raman utilizing a microscope in the epi-direction.
The Raman signal is passed via a side port on the microscope to a collection lens with an f-number matching the Andor HoloSpec ƒ/1.8i spectrograph. The main benefit of this spectrograph is the modular nature of its components, namely the entrance slit and grating are easily swapped for use with different excitation wavelengths or application requirements. Raman Scattering is then passed through a slit and reflected off a holographic grating. Upon reflection from the grating the diffracted light is projected onto an Andor Newton 940 CCD with 2048 by 512 pixels. Calibration of the spectral coordinate is performed using a standard (e.g.50/50 v/v acetonitrile toluene) with known spectral peak locations. Figure 2 shows the spectrum of a background subtracted 1500-nm polystyrene film obtained using 30-mW 532-nm excitation. A Raman image can be generated by raster scanning the stage over the laser [1]. Other Raman imaging techniques have also been developed in which a tunable filter is used to image the presence of Raman scattering at a specific wavenumber region [2,3]. The entire image is taken in one exposure with an imaging CCD, but the tunable filter must be adjusted for each wavenumber region collected.
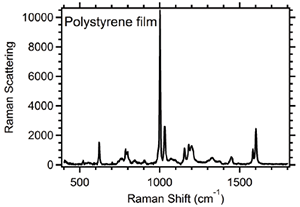
Figure 2: Raman spectrum of a 1500 nm polystyrene film displaying its characteristic peaks.
Total internal reflection (TIR) Raman microscopy can be used to measure thin films and interfacial phenomena with reduced background from the bulk medium. Examination of thin films is an important endeavour in many fields, for example the analysis of thin film-based electronic devices. The amount of Raman signal is decreased due to the small probe volume in the case of thin films. A further complication to obtaining meaningful thin film measurements is a signal from the bulk, including the background from optics and the bulk medium, that may dominate the signal. TIR Raman microscopy has the benefit of probing the sample with an evanescent wave as opposed to direct illumination, thus limiting the distance over which the Raman signal is obtained. TIR Raman microscopy can be used to enhance the signal from the thin film and reject background signals.
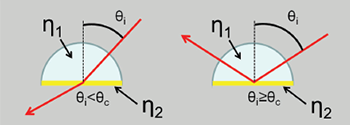
Figure 3: Schematic of a prism sample interface showing conditions for refracted and reflected light.
TIR requires the laser be directed onto an interface between medium 1 and 2 (Figure 3) with indices of refraction η1 > η2 at an incident angle (θi) greater than or equal to the critical angle (θc) as determined by Snell’s law: θc=sin-1(η2 / η1). Two routes are available to achieve TIR: sending the laser through the objective or using an external prism. Through the objective requires a collimated laser that is directed off axis through a high numerical aperture (generally 1.45 or higher) objective. TIR through the objective has the benefit of easy setup, but is limited by the effective angle range, which may be problematic if the critical angle cannot be reached for a given interface. The index of refraction of most objectives typically limits the usefulness to aqueous systems. Alternatively, the sample may be optically coupled to an external prism.
Prism-based TIR allows for a wide range of usable angles and the choice of prism materials. One downside is the complexity of the instrumentation involved to deliver the laser to the prism. This can be mitigated by using a fiber introduction as described below. Figure 4 shows the schematic for a prism-based TIR Raman microscope. The laser is focused onto a fiber optic that has the other end terminated with a variable collimator to focus the laser on a high index of refraction hemispherical prism. An arm mounted on a rotary stage is set so the center of rotation is at the sample plane and does not move. The laser is then introduced at the same position on the prism regardless of angle. The collection of the Raman scattering is the same as described above for conventional Raman microscopy.
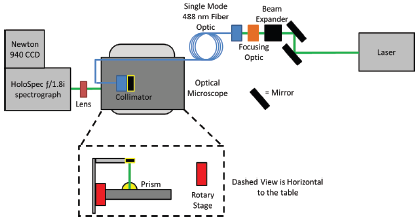
Figure 4: Schematic for prism-based scanning angle Raman/reflectivity instrument utilizing laser introduction via a fiber optic
The TIR Raman spectra for a sapphire/polystyrene/air interface are shown in Figure 5 (15 mW 532 nm excitation). An enhancement in the measured Raman signal occurs as the laser’s incident angle approaches 64°, which is close to the critical angle for a sapphire/polystyrene interface. TIR Raman microscopy is quite sensitive and can be used to measure a single monolayer [4].
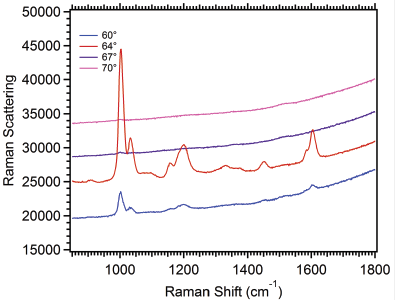
Figure 5: SA measurements of an 800 nm film of polystyrene film ranging just below to above the critical angle.
Written by Michael D. Lesoine and Emily A. Smith. Construction of the Raman instrument was carried out by and for Professor Emily Smith’s research group at The Ames Laboratory and was supported by the U.S. Department of Energy, Office of Basic Energy Sciences, Division of Chemical Sciences, Geosciences, and Biosciences. The Ames Laboratory is operated for the U.S. Department of Energy by Iowa State University under Contract No. DE-AC02-07CH11358.
References

© Oxford Instruments 2026
