Resources
 Part of the Oxford Instruments Group
Expand
Collapse
Part of the Oxford Instruments Group
Technical Article
Author: Andrew P. Carpenter, PhD
Published: 01 May 2024 · Last updated: 11 Jun 2024
Tags: plasma-studies-app
Nonlinear Optical Spectroscopy covers a broad category of spectroscopic techniques researchers use to study biological systems, ultrafast dynamics, chemical reactions, and much more.[1-3] The primary characteristic of a nonlinear spectroscopic method is that multiple photons interact with the material system of interest, either simultaneously or with well-controlled time delays between pulses. This is contrasted to the “one photon in, one photon out” characteristic of linear spectroscopies. While the introduction of multiple incident photons adds complexity to any experimental design, the physical and chemical information that can be obtained becomes much richer.
In this technical note we will consider a general background to nonlinear optical spectroscopy, highlight the manner in which the nonlinear signals are measured and how spectra are constructed, and present a few examples of nonlinear optical spectroscopies.
Every nonlinear spectroscopic method involves multiple photons interacting with a material system of interest. From an experimental viewpoint this can involve multiple photons from a single laser pulse simultaneously interacting with the material (ex. Second Harmonic Generation(SHG)) or photons from multiple laser pulses and varying time delays interacting with the material system (ex. multi-dimensional spectroscopies). To describe a material’s nonlinear response the presence of multiple photon electric fields the polarization density (P) needs to be considered. This represents the material’s vibrational or electronic dipole moment per unit volume when probing vibrational or electronic transitions, respectively.
The material polarization can be expressed as an expansion of its n-order contributions (see equation).[4]
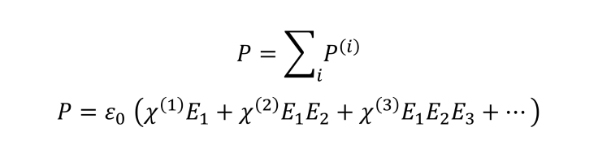
The nth-order contribution to the material polarization (P(n)) can be written in terms of the nth-order susceptibility (X(n)) and n incident electric fields coming from the incident photons. The electric fields of these incident photons can be degenerate (ex. E1 = E2) or unique. The polarization density can be described within a time or frequency domain representation, just like nonlinear optical signals can be detected in the time or frequency domain.
Colloquially, nonlinear spectroscopies are often referred to as nth-order spectroscopies, which is related to the nth-order polarization and number of interacting electric fields. It is also common to see some methods referred to as (n+1) wave mixing spectroscopies to include the electric field of emitted photon. As an example, Sum-Frequency Generation (SFG) spectroscopy is most commonly referred to as a 2nd-order spectroscopy and, sometimes, as a 3-wave mixing spectroscopy. This is because SFG is a “x(2) spectroscopy” that includes two incident photons and its emitted photon. Whether the nonlinear spectroscopic method described by the material polarization is probing electronic or vibrational transitions, or both, will depend on the energy of the incident electric fields and the optical properties of the material system.
Optical properties of a material system will be encompassed within the susceptibility (X) which describes all optical phenomena ranging from absorption to refraction to light scattering and more. A material’s linear optical response, measured by linear spectroscopies, will be described by the first-order susceptibility (x(1)). All nonlinear spectroscopies will be described by the relevant nth-order susceptibility (x(n)) for any n>1). Mathematically, the nth-order susceptibility will be represented by an n+1 ranked tensor. For example, coherent anti-Stokes Raman spectroscopy (CARS) is a 3rd-order nonlinear spectroscopy and the relevant susceptibility (x(3)) will be represented by a fourth-rank tensor. Likewise, SHG is a 2nd-order nonlinear spectroscopy with the relevant susceptibility (x(2)) being described by a third-rank tensor.
From an experimental standpoint, nonlinear spectroscopies require more intense laser fields than linear spectroscopies due to the order of magnitude of the elements within the susceptibility tensors (Table 1). Because of this, the first nonlinear experiments weren’t realized until after the invention of the laser. Ironically, the first experimental demonstration a nonlinear optical phenomenon (SHG) was removed by a copy-editor, thinking the second-harmonic response was a smudge.[5] Today, the use of ultrafast pulsed laser systems is common within the field of nonlinear optical spectroscopy.
| xi(1) | xij(2) | xijk(3) | |
| Approximate Magnitude | 1 |  |
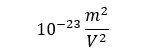 |
Table 1. Relative magnitude and units of tensor elements of the first three susceptibility tensors.
It should be mentioned that the susceptibilities mentioned here are macroscopic observables describing an ensemble of molecular responses within a material. They possess molecular equivalents that are directly related to the electronic and nuclear properties of the constituent molecules in the system. For example - the first-order susceptibility is related to the molecular polarizability (α), the second-order susceptibility is related to the molecular hyperpolarizability (Β), the third-order susceptibility to the second-order hyperpolarizability (γ), and so on and so forth. May great resources are available for those who are interested in a deeper exploration into the connection between the molecular and macroscopic quantities and the theory of non-linear spectroscopy.[4,6-7]
To measure a nonlinear optical signal, it is important to understand how the signal is emitted. The desired signal in a nonlinear optical experiment will be emitted in the momentum preserving “phase-matched” direction. The concept of a phase-matched direction is important as it provides one way to separate the desired nonlinear optical signal from the incident laser beams. Illustrated below are the phase-matching conditions of three 2nd-order nonlinear spectroscopies – SHG, difference frequency generation (DFG), and SFG (Figure 1). For each spectroscopy the signal wavevector (ks) is a summation of the incident photon wavevectors (k1 and k2). The colinear nature of incident photons in a SHG experiments results in the emission of the second-harmonic photon in the phase-matched direction that is colinear with the incident beams, necessitating the use of frequency and/or polarization filters to ensure only the SH signal reaches the detector.
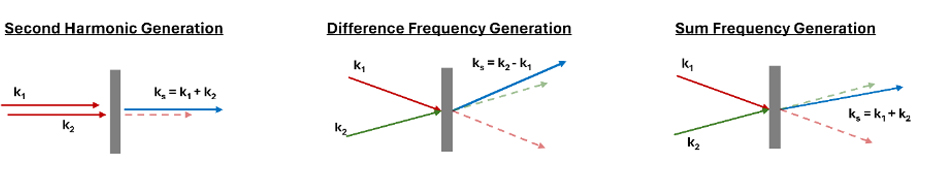
Figure 1. Phase matched conditions for common second-order nonlinear spectroscopies.
In DFG and SFG experiments, however, it is common for the incident beams to arrive at the sample position in a non-colinear geometry. Since momentum of the incident photons is conserved during the emission of the nonlinear photon in the phase-matched direction, the wavevector of the emitted second-order response is spatially separated from that of the excitation laser beams. Frequency and polarization filters may still be used, but in a non-colinear beam geometry it is possible to spatially separate the optical signal of interest. Another, classic, example of phase-matching is the “box-car” geometry that is often found in multi-dimensional spectroscopy experiments.[8] Phase-matching influences which nonlinear signal is dominant, thus it can be generally said that the specific optical property being studied will influence the detection of the nonlinear signal.
Once the nonlinear optical signal has been isolated, constructing a spectrum will depend on the nature of the experiment and the desired information. One of the most critical choices when building an experimental system to measure nonlinear spectra is whether to measure in the temporal or frequency domain. To measure a nonlinear spectrum in the temporal domain typically makes use of a fast single point detector and then Fourier transforming and filtering of the resulting time-resolved signal. Meanwhile, spectral measurements in the frequency domain require some manner of frequency dispersion of the optical signal and resolution of the intensity as a function of wavelength. This latter scenario is easily accommodated using a spectrograph and CCD and sCMOS cameras.
Once a nonlinear optical signal has been isolated from other light sources how are these signals measured? At the highest level, detectors can be broadly binned as single-point detectors or array detectors. The photoactive region of these sensors will be constructed from a material whose band gap is lower than the energy of the photons being measured to ensure the photon excites an electron-hole pair within the photoactive region. The frequency dependence of this process is reflected in a camera sensor’s Quantum Efficiency (QE) curve. As an example, silicon has a band gap of 1.1 eV making it the go-to material to make sensors for measuring UV-NIR light below 1100 nm. At longer wavelengths, beyond 1100 nm, other materials (ex. InGaAs and HgCdTe) become necessary to directly detect SWIR, mid-IR, and longer wavelengths of light.
The spatial arrangement of detector array will impact their application to detecting nonlinear signals in terms of temporal, frequency, and spatial resolution. As the name suggests, single-point detectors are a class of photodetectors that consist of a single “pixel” and include photodiodes, photomultiplier tubes (PMT), and avalanche photodiodes (APD). Array detectors include charge-coupled devices (CCDs), scientific complementary metal-oxide semiconductors (sCMOS) detectors, and point-detector arrays. Array detectors are commonly found in sizes exceeding a million pixels.
While point detectors hold an advantage in their read-out speed, only having to read out a single “pixel”, imaging the spatial and frequency dispersion with array detectors allows users to resolve images and spectra in a single shot. While both detector types can be used for spectroscopy, the following discussion and examples will focus exclusively on array detector cameras for nonlinear spectroscopic applications.
When considering a camera for use in a nonlinear spectroscopy experiment the sensitivity, noise, resolution, and bandpass all need to be considered as they will affect the success of a given experiment. To give a sense for how these factors will affect a nonlinear spectroscopy experiment, consider the following. Quantum efficiency gives a measure of how many photons that are incident on the detector will be converted into photoelectron (i.e. signal). Higher QE will result in a more sensitive detector, which is particularly valuable when nonlinear signals are weak. Several noise sources, such as the read noise and dark noise, will contribute to the noise floor. In the event the nonlinear optical signals are below the noise floor (SNR < 1), several detector solutions exist that can allow researchers to boost these undetectable nonlinear optical signals above the noise floor. These include spectroscopy and imaging electron multiplying CCDs (EMCCDs) as well as intensified CCDs and sCMOS cameras. Specific camera features that impact QE and noise contributions include the sensor temperature, read out rates, and binning.
Once the nonlinear optical signal exceeds the noise floor, the question of spectral bandpass and resolution becomes relevant. A convenient and robust way to spectrally disperse nonlinear spectra, for frequency domain detection, is to mount the camera onto a spectrograph. When using a spectrograph + camera system, one needs to consider the spectrograph and camera properties that will affect bandpass and resolution. The measurable bandpass of a spectrograph + camera system will be a function of the diffraction grating density, spectrograph focal length, and sensor width. Resolution will be similar in that it is also dependent on the grating and spectrograph focal length, and pixel size (instead of sensor width).
Let’s briefly consider how these factors will impact a nonlinear spectrum’s bandpass and resolution. Holding constant the camera sensor/pixel size and spectrograph focal length, increases in the diffraction grating density will result in higher resolution and lower bandpass. Now, hold constant the diffraction grating density and camera properties, longer focal lengths result in higher resolution and lower bandpass. Finally, given constant spectrograph properties and variation in the camera sensor width and pixel sizes, one will find the pixel size impacts the resolution while the sensor width impacts the bandpass that is simultaneously imaged onto the camera. Online tools, such as Andor’s resolution calculator, can help assess the impact of certain grating/focal length/camera combinations on resolution and bandpass.
Nonlinear Spectroscopic Method: Vibrational Sum-Frequency Scattering Spectroscopy
Principle Finding: Surface electric fields propagate through nanoparticle interiors such that molecules adsorbed to a nanoparticle surface don’t just feel the electric potential of neighboring charges but will respond to the electric fields of charges positioned on the opposite side of the particle. Golbek and Weidner show how this phenomenon influences the surface orientation of proteins at nanoparticle surfaces using polarization resolved sum-frequency scattering spectra. As the nanoparticle diameter approaches a micron, the protein orientation is observed to converge towards the protein orientation observed at extended planar surfaces. Golbek and Weidner’s results indicate researchers need to take when designing experiments to study protein behavior at surfaces because their structural composition can be altered at high curvature surfaces.
Detection Solution: Vibrational sum-frequency scattering experiments are difficult experiments to build, with extremely weak signals that are scattered in a coherent fashion. In this scenario, the nonlinear spectrum was spectrally dispersed using a spectrograph (Kymera 328i) onto an intensified CCD (iStar CCD). The scattered sum-frequency signal exists amongst a background of incoherently scattered visible light (from the incident visible laser). The fast gating of the iStar CCD allows researchers to gate out background light with nanosecond precision, while the intensifier amplifies the weak nonlinear signal above the noise floor of the CCD sensor to enhance data signal-to-noise (SNR).
Nonlinear Spectroscopic Method: Gradient-Assisted Photon Echo spectroscopy (GRAPE)
Principle Finding: Two dimensional electronic spectroscopies (2DES) are powerful tools that allow researchers to investigate the electronic structure and dynamics of samples ranging from proteins to molecular aggregates. At the time of this publication, these 2DES experiments typically proceeded via point-by-point acquisitions that resulted in long experimental acquisition times. Such long acquisition times inhibited the ability of researchers to observe and monitor the evolution of electronic structure and dynamics over the time scale of a typical experiment. In this work, Harel and Engel demonstrated the ability to measure a 2DES spectrum in a single laser shot, decreasing the acquisition time by several orders of magnitude while maintaining femtosecond resolution.
Detection Solution: To measure 2DES spectra in a single shot, the authors combined tilting some of the pulse wavefronts and imaging the heterodyned third-order signal through an Andor third meter focal length imaging Czerny-Truner spectrograph onto an iKon-L CCD. The use of a spectrograph allowed the researchers to disperse their signal along a frequency axis while simultaneously imaging a temporal dimension along the second axis. While the read-out speed of the CCD is not quick enough to truly measure a 2DES spectrum in a single pulse, the authors show how the SNR for a single pulse is sufficiently above the noise floor.
Nonlinear Spectroscopic Method: Transient X-Ray Absorption Spectroscopy
Principle Finding: Urea is a central molecule in current origin of life hypotheses as photoreacted products of urea are precursors for nucleobases. Of interest is the dynamics of photo-induced proton transfer within the urea dimer which is believed to be an initial step within its reaction pathways. Using ultrafast x-ray pulses within the water window, generated via high harmonic generation, Yin et. al were able to monitor the photo-initiated proton transfer between two urea dimers in an aqueous solution. Beyond understanding proton transfer within this urea system, Yin and coworkers use of the water window in x-ray spectroscopy provides a nice demonstration of a method that can help elucidate the nuclear and electronic dynamics within aqueous environments.
Detection Solution: Transient x-ray absorption spectroscopy within the x-ray water window (~280-530 eV) requires the ability to resolve small changes in absorption between pump off and pump on states. These changes in absorption can amount to small fractions of a percent difference, necessitating a highly sensitive camera. The key detector technology used in these experiments was the Newton SO CCD which is an open-faced spectroscopy purposed CCD with high QE in the x-ray water window.
Nonlinear Spectroscopic Method: Coherent anti-Stokes Raman Spectroscopy (CARS)
Principle Finding: Temperature measurements in combustion environments can be performed using thermocouples or optical measurements. In this work, Bai and Chen and coworkers show combustion temperatures measured by thermocouples and CARS are consistent in an adiabatic environment (tubular furnace). However, when the same measurement devices are used in an open environment (McKenna burner), the two measurements deviate from one another with the thermocouples underreporting the temperature. The authors go on to use the CARS derived temperature to correct the thermocouples. This work by Bai et. al provides a nice illustration of the robustness of using CARS as an optical temperatures probe in different combustion environments.
Detection Solution: Many different optical signals are emitted during combustion events, with not all of them being informative. To isolate the spectral responses necessary to calculate temperature, Bai et. al used a spectrograph (Shamrock 500i) to disperse the CARS signal onto an intensified CCD (iStar CCD). With gate times of 100 ns, the fast time gating of the iStar CCD allowed the researchers to temporally isolate the spectral response they desired while gating out other responses that could interfere with their analysis.
Nonlinear Spectroscopic Method: Optical Kerr Effect (OKE) and THz Kerr Effect (TKE)
Principle Finding: The nonlinear Kerr effect is a change in a materials refractive index due to the intense electric fields of multiple incident radiation fields. Measuring time dependent OKE and TKE traces opens the door to understanding the complicated couplings between low-energy rotational and vibrational energy modes. However, experimental times incurred from scanning across a single motorized time delay are long and can last for days for multidimensional Kerr spectroscopies. In this work, Mead and Blake and co-workers demonstrate the single-shot acquisition of OKE and TKE traces, across 10’s of picoseconds, using an stair-step echelon in the probe beam bath. They go on to investigate the signal-to-noise properties of these experiments and show OKE and TKE measurements can be acquired in as little as 10 ms. The authors conclude by offering their perspective on how this spectrometer design provides an avenue to significantly reducing the time in multidimensional TKE spectroscopies.
Detection Solution: Single-shot time-dependent methods require detectors with good sensitivity, a high dynamic range, and the ability to establish a temporal correlation across the sensor because the time-delay is spatially encoded across the camera sensor. For these experiments an sCMOS was used with a global shutter (Zyla 5.5). The global shutter ensures good temporal correlation across the entire image and that no artifacts from rolling shutters appear. The sCMOS also boasts fast frame rates, dynamic range of 33,000:1, and high QE with low read and dark noise contributions for excellent signal-to-noise. The combination of all these features enables the accumulation of a good signal-to-noise in a matter of milliseconds.

© Oxford Instruments 2026
