Resources
 Part of the Oxford Instruments Group
Expand
Collapse
Part of the Oxford Instruments Group
FAQs & Glossaries
Author: Dr Claudia Florindo and Dr Alan Mullan
Published: 01 Feb 2022 · Last updated: 05 Dec 2023
Aliasing is a phenomenon that causes different signals to become impossible to differentiate when under-sampled. This problem is more apparent if the object to be sampled has a repetitive pattern (such as a zebra). In microscopy, aliasing is caused when the sampling of the imaging camera (i.e. the size of the pixels) is too large for the detail to be imaged, which will cause the image to be under-sampled.
To properly sample an image in microscopy, images should be acquired according to the Nyquist criterium (Nyquist sampling theorem). Andor spinning disk microscope, Dragonfly has a choice of camera magnifications to achieve Nyquist depending on the limits of the properties of your objective and camera pixel size.
A system is said to be astigmatic when rays will not converge in the same focal point and will have different focal points. If the objective lenses of the microscope are not corrected for astigmatism, they will deliver a poor-quality image.
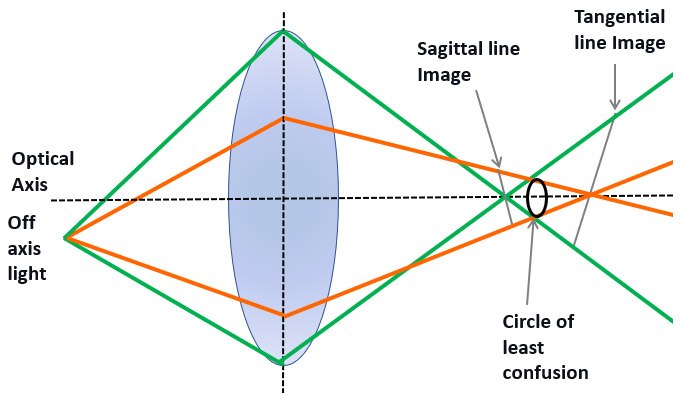
Nevertheless, in microscopy, the use of an astigmatic lens can be used to the researcher’s advantage. In 3D STORM, an astigmatic lens placed in the imaging path allowing 3D super-resolution imaging. This option can be included in the Andor spinning disk micro-scope, Dragonfly 500.
The Borealis illumination system was developed to allow the highest possible uniformity of illumination over the full field of view. Borealis illumination avoids the loss of illumination intensity often seen at the edges of each tile of an image montage, and therefore, the stitching of multiple tiles will be seamless. A flat illumination profile is also essential for proper imaging quantification. Andor spinning disk microscope, Dragonfly uses Borealis as its illumination system, delivering 2 to 3X increase factor in both throughput and uniformity.
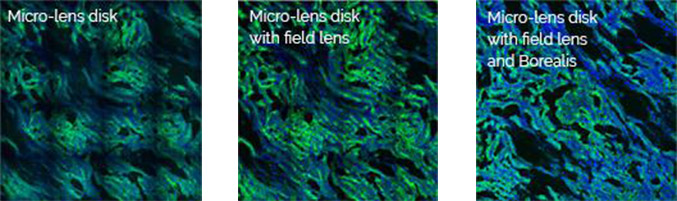
With Borealis, and its unique Perfect Illumination Delivery™ system (right), it avoids the edges having non-uniformities that can cause issues for stitched data and quantitative measurements across the field of view.
Borealis and its unique Perfect Illumination Delivery™ system (right) avoids the edges having non-uniformities that can cause issues for stitched data and quantitative measurements across the field of view.
Borealis illumination is patented and can only be delivered by Andor.

Brightfield is the most straightforward microscopy technique using transmitted light. The sample is illuminated with light from below. The contrast is generated by phase differences within the sample as the light passes through the it. Many biological samples are difficult to visualise in brightfield as cells are made mainly of water and therefore provide little contrast.
Contrast can be significantly improved by using dyes that bind to specific cell structures. However, the techniques required for these dyes need specific sample preparation, such as heat, or chemical fixation. For this reason, the use of dyes to visualise the sample in brightfield is not compatible with live imaging. Brightfield is a highly useful technique and appropriate for some samples that have are coloured structures, such as chloroplasts.
CCD stands for Charged Coupled Device. CCDs are one of the imaging sensor technologies used in modern scientific imaging cameras. The CCD sensor itself is composed of many small pixel elements in which incoming photons are converted into electrons. The electron current is converted into a digital value that corresponds to the intensity of the incoming light for each pixel, and a digitized image can be reconstructed from these values.
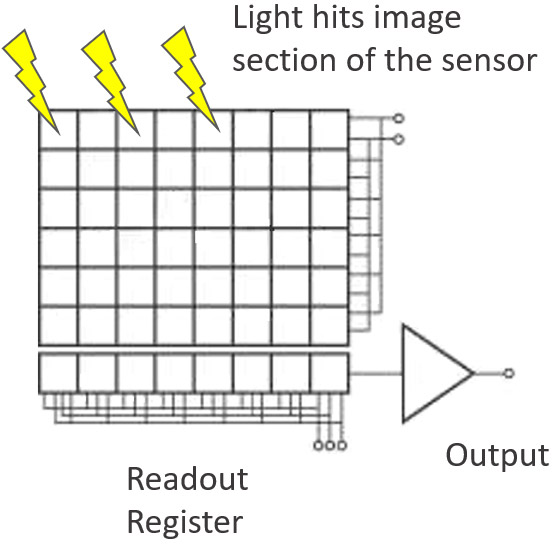
CCD sensors are known for good image quality and very low dark current – this makes them very suitable for long exposure applications. The downside of CCD is that the pixel readout process is serial in nature, and this limits their imaging speed (and sensor sizes). Therefore, other sensor technologies such as sCMOS are more suitable for imaging of live cells, and faster processes. A development of CCD is EMCCD which allows for even greater sensitivity and much higher speeds. Either EMCCDs or sCMOS detectors can are used as detectors for multipoint confocal systems such as Dragonfly or the Andor Benchtop Confocal.
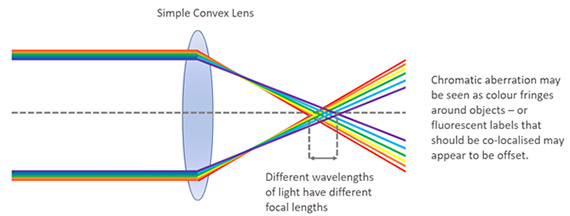
Chromatic aberration is an optical defect that arises due to the optical characteristics of light. When the light goes through a lens, different wavelengths are retarded to different extents, shorter wavelengths present higher retardation than longer ones. The result is that when no correction is applied, structures that colocalize will not appear in the same Z plane, and therefore will not appear to colocalize.
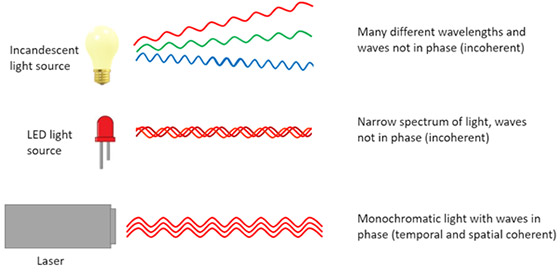
A beam of light is said to be Coherent when all the waves in the beam are in the same phase. Lasers such as the ones used for illumination in confocal systems use coherent light.
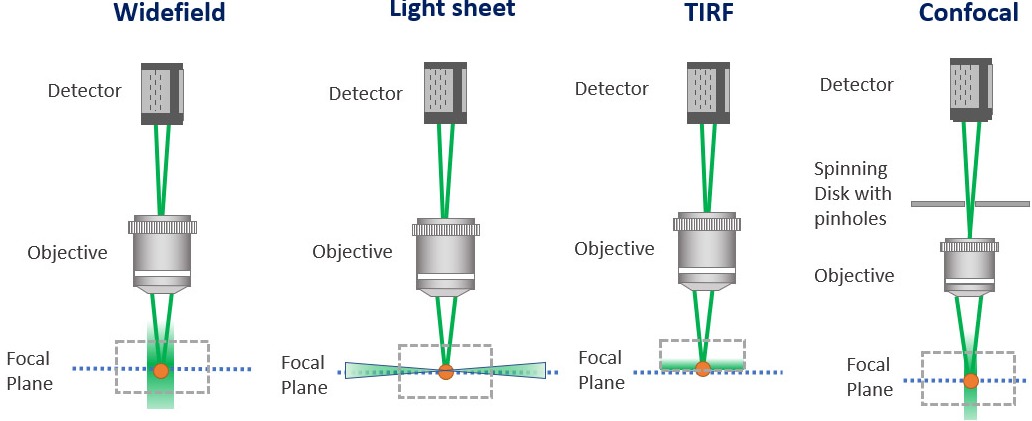
Confocal microscopes work by having a pinhole within the light path. Upon sample illumination, and subsequent emission, only the in-focus light will reach the detector. The out of focus light will be discarded.
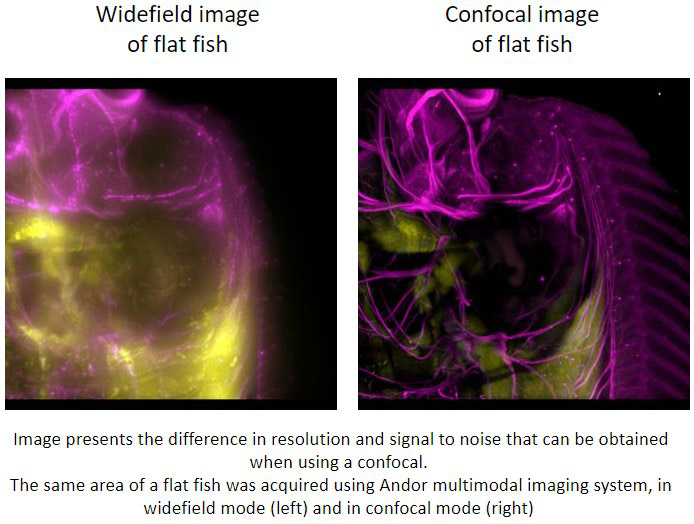
The S/N (signal to noise) ratio, which is an essential parameter for a microscopic image, is increased in a confocal image compared to widefield microscopy. In practical terms, a confocal microscope removes the blur of the image that is seen in conventional widefield microscopy.
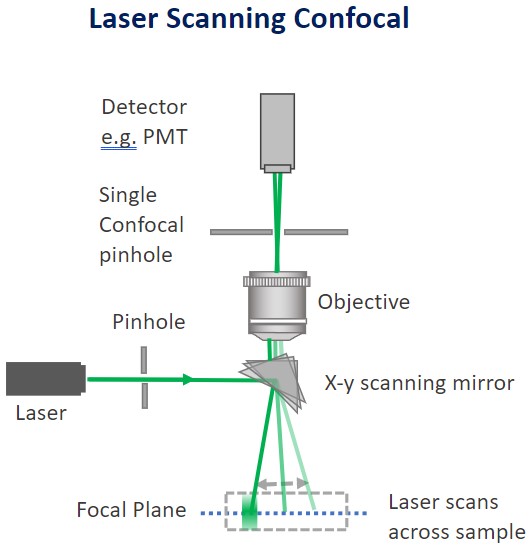
Confocal microscopes can either be “point scanners” (have a single pinhole) or “multipoint confocal” (have multiple pinholes). Multipoint confocal systems have several advantages when compared to point scanners such as improved speed and sensitivity.
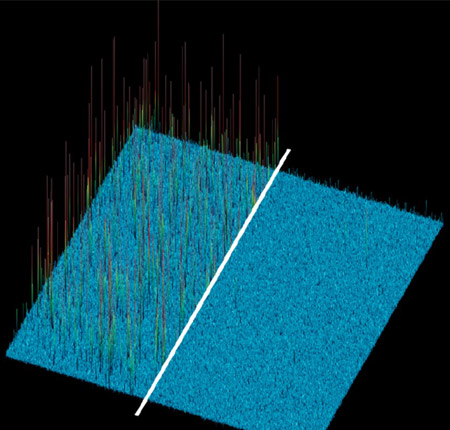
The Dark current is a noise present in sensors that increases as a function of time. Cooling a camera sensor not only reduces dark current but also other pixel non-uniformities.
Dark current is a source of noise within imaging cameras. Dark current is the residual noise generated by the sensor itself in the absence of any external signal, hence the name “Dark” current.
Dark current increases proportionally with exposure time and therefore becomes important for applications such as luminescence, that require long exposures of many minutes. CCD and EMCCD cameras have significantly lower dark current than sCMOS cameras. Cooling can be used to significantly reduce dark current. Cameras such as iKon CCD and iXon EMCCD use deep cooling to achieve the lowest possible dark current and best possible S/N (signal to noise) for these long exposure applications.
When light passes through the different optical elements within any optical system be it a microscope or telescope, or series of lenses, it suffers distortions. This process is named “convolution”. The result of this is that images will appear blurred.
Deconvolution is the process by which the distortions of convolution are mathematically corrected. This removes the blur and fog of the of the uncorrected image. Deconvolution therefore increases the SNR (signal to noise ratio) and boosts resolution of the image. The reassignment of photons to the correct place (i.e. a perfect optical system without distortion) is performed simply and exceptionally well by modern software such as Fusion for high contrast detailed images.
The image shows the widefield image before Deconvolution (left) and after deconvolution (right). The image was acquired with Andor Benchtop confocal.
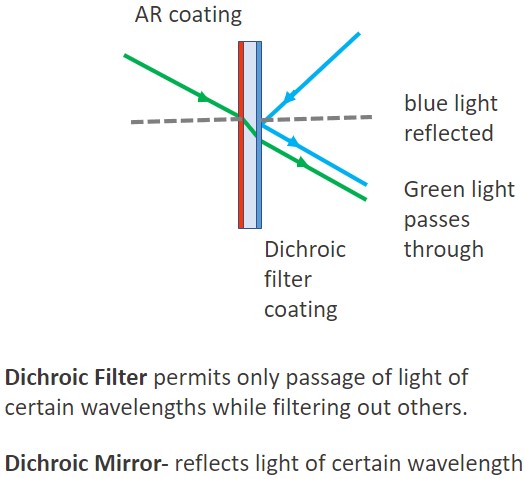
A dichroic (also named as a beam splitter) is a filter in which a coating or optical material is used to selectively allow the passage of specific wavelengths (as if it is transparent to them), but simultaneously act as a barrier to others. The selective passage of wavelengths within a defined bandwidth by the dichroic mirrors is essential to properly separate cellular structures stained with different dyes. Microscopes in which the design and quality of the dichroic are optimized allow the simultaneous capture of different dyes without signal bleedthrough, or crosstalk.
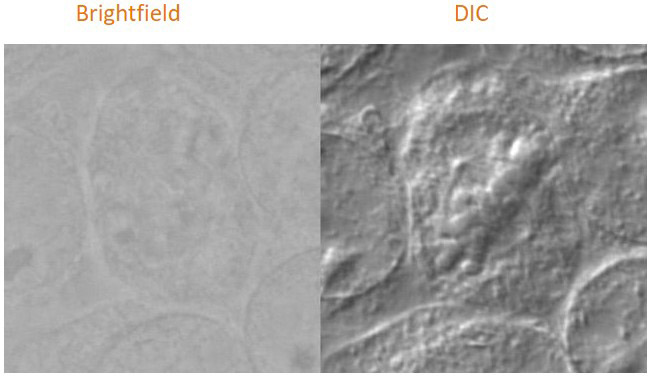
Differential interference contrast (DIC) can be an effective way to boost contrast in unstained, low contrast, transparent samples compared to normal brightfield imaging as is shown in this example image.
Differential interference contrast (DIC) is a microscopy technique that enhances the contrast in unstained, low contrast, transparent samples. The optics required for DIC are complex, so it should be noted that this technique is not available on all microscopes.
In simple terms: the light is separated into 2 orthogonal polarised coherent rays that go through the sample and subject to different interferences. When the 2 waves are joined the difference in shift that both rays suffered generates a pseudo-3D effect that strongly enhances the contrast differences and visualisation of details within the sample. DIC is extremely useful for live imaging microscopy either using in unstained cells, or cells with fluorescent markers.
DNA-PAINT (point accumulation for imaging in nanoscale topology) is a super-resolution method that exploits transient hybridization between short oligonucleotides strands to visualize nanostructures Resolution of 5-10 nm can be routinely achieved. A “docking strand” is targeted to a motif of interest via antibody or aptamer or similar and the imager strand in solution binds stochastically, HLE or ILE with iZoom provides intense laser illumination to bleach background fluorescence and highlighted binding events for high precision localization.
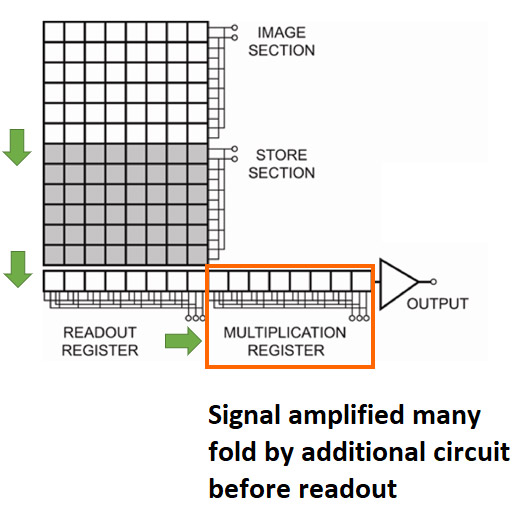
The key to the effectiveness of EMCCD for low light imaging is the additional “EM gain” circuit that boosts the signal many fold before the readout process. This enables very low level signals that would otherwise be lost in the noise floor to be detected.
EMCCD (Electron Multiplying Charge Coupled Device) is a specialised CCD camera technology used for the most demanding imaging applications. An additional Electron Multiplication circuit is present that using a process called impact ionization that enables the signal to be boosted hundreds of times before it is read out. This unique technology allows these cameras to operate at sub-electron read noise, and therefore detect lower signal levels than other camera technologies, such as sCMOS or conventional CCD cameras.
EMCCD cameras such as the iXon EMCCD series are therefore most suitable for very low light imaging applications such as single molecule detection. When light levels are not so restricted, EMCCD cameras do not perform as well as sCMOS cameras. This is due to the slower readout speeds of EMCCD and that the EM gain process introduces an extra noise factor. However, for the lowest signals EMCCD still provides the best imaging performance available.
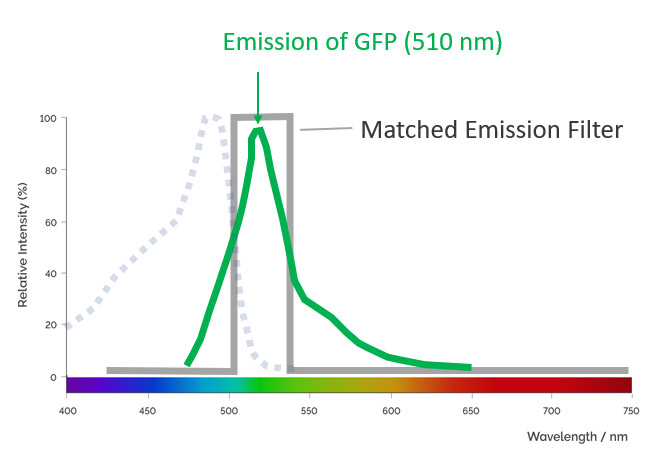
An emission filter is used in microscopy to allow only the appropriate fluorescence signal emitted from the sample to reach the detector. At the same time, it blocks the undesirable wavelengths of excitation light. The emission filter only permits a narrow band of wavelengths to pass through it. The microscopist should choose the fluorophores taking in consideration the band pass of the microscope filters. Microscopes should have filters optimised to allow the collection of different fluorochromes without signal bleed-through (that gives poor contrast).
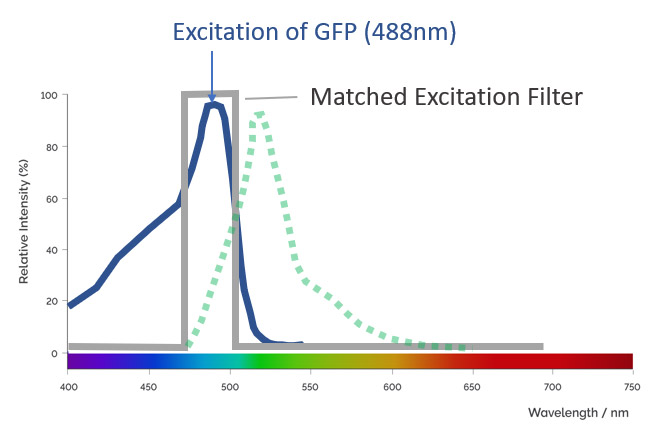
An excitation filter is used in microscopy to filter the light that comes from the illumination source. Excitation filters allow the passage of the specific wavelengths while blocking the remaining wavelengths. By optimizing the selection of excitation, dichroic and emission filters, the best possible collection of signals from different fluorochromes can be achieved without signal bleed-through.
Dragonfly is optimized in such a way that channels can be acquired simultaneously without bleed-through.
A filter cube is as the name indicates, is a cube that joins together a number of filters in the correct orientation for fluorescence microscopy: i.e. the excitation, the emission and the dichroic filters.
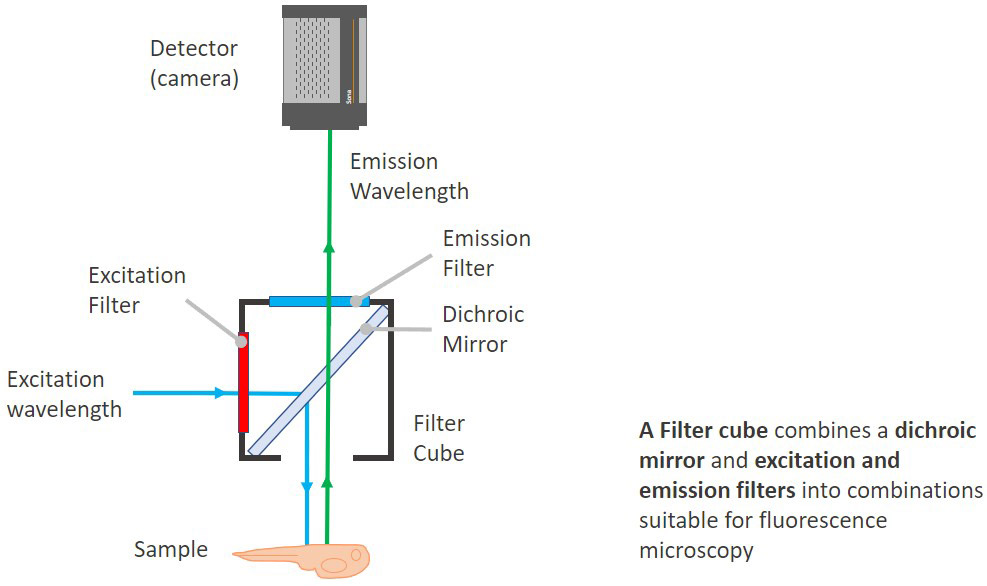
The dichroic is set in a 45º angle in the cube between the excitation and the emission filters. Modern Microscopes generally do not have all the filters in a cube. Having the filters in separated filter wheels allows more flexibility for experimental protocols and imaging acquisition.
In most microscopes, the illumination is not homogeneous (flat) across all the field of view. The area of the field with better illumination for imaging is the central region. Towards the edges, there is often a drop in light intensity.
Flat field illumination is achieved when the whole field of view is illuminated with the same light intensity. For experiments that require quantification, or for imaging, a large organism by stitching multiple panels, homogeneous illumination of the sample, and therefore homogenous illumination of the field of view is an essential requirement.
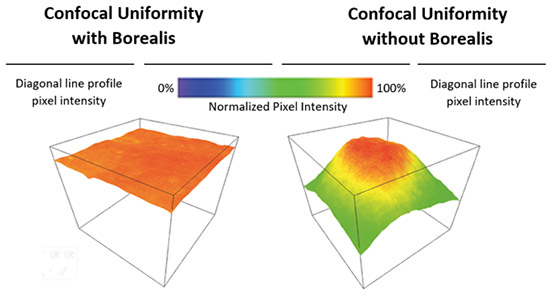
Image represents a confocal spinning disk with flat illumination profile (left) and with edge role off (right)
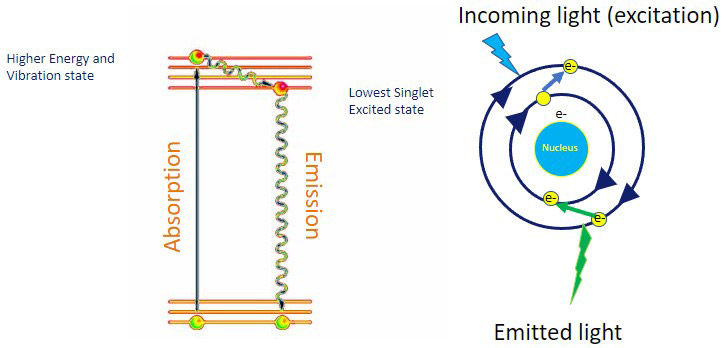
A compound is said to be fluorescent if it can absorb light of a specific wavelength and then emit light of a wavelength longer than the one absorbed. Fluorescence, therefore, is the emission of photons by atoms or molecules whose electrons are transiently stimulated to a higher excitation state by radiant energy from an outside source. Fluorescence ceases the moment that incident excitation light terminates. Proteins and other molecules of interest can be selectively labelled with fluorescent tags or labels. This is the basis of fluorescence microscopy.
Ideally, microscopes should have a set of filters that allow proper separation of excitation and emission spectra of different fluorescent molecules used in bioimaging. The Andor Spinning Disk Microscope, Dragonfly for example, has an optimal selection of filters and dichroics that allow simultaneous acquisition of different channels without signal bleed-through.
When a molecule absorbs light, the electrons “jump” to a higher energy level. The subsequent return of the electrons to their ground energy state is accompanied by a release of a packet of energy in the form of light (photons). The emitted light has a longer wavelength than the wavelength of the absorbed light (i.e., lower energy).
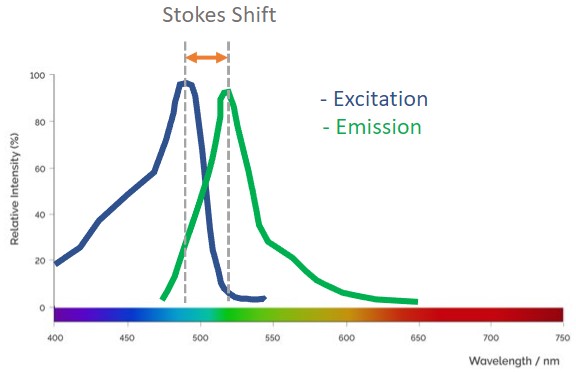
Fluorescence spectra describe the absorption and emission information for a compound. In bioimaging, this information is essential to be able to set up the acquisition parameters for the imaging system. The user should ensure that both the imaging system and the detector can capture the signal of the fluorescent molecules used on the experimental set up.
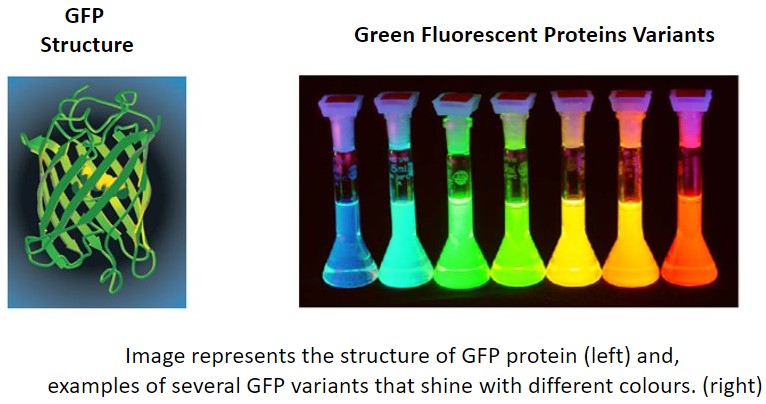
Fluorescent proteins are proteins that can emit light upon absorption of the specific excitation wavelengths. The first fluorescent protein to be discovered was GFP (Green Fluorescent Protein). Researchers often express their gene of interest in frame with the coding sequence of a fluorescent protein. This strategy enables them to track the expression dynamics of their protein of interest in real-time.
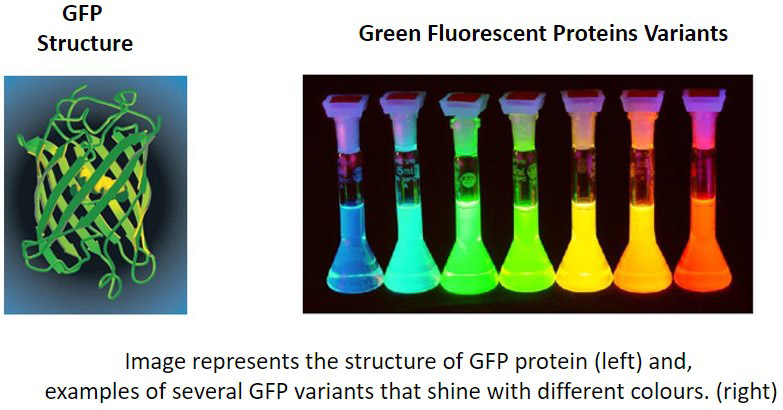
There are now a very wide range of fluorescent proteins (including engineered forms) with different colours that are used in a variety of applications for live-cell imaging and optogenetics. It is possible to use and combine multiple fluorescent labels to view the correlation between different cellular components to help unravel complex processes and relationships within the cell.
Objective Focal length – or Focal distance. Is the distance between the objective lens and the top of the object in order to be able to image it in-focus. In microscopes, generally, the longer the focal distance, the lower the magnification of the objective. For high magnifications, the objective lens will be very close to the sample, meaning you may need to be careful when focusing to avoid breaking a coverslip for example. When choosing a microscope system, the objectives need to be chosen so that the focal length is appropriate to the desired experimental setup and samples.
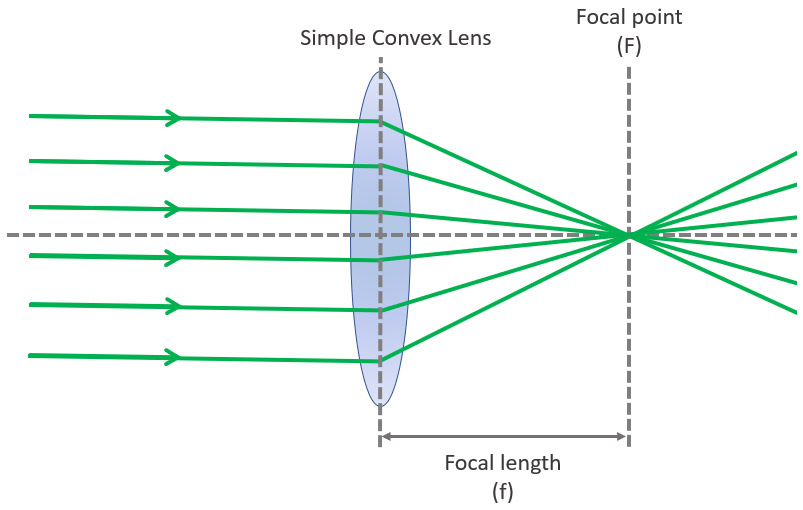
The focal plane is an imaginary plane that crosses the axis where the sample is in focus. It is perpendicular to the axis of the lens.
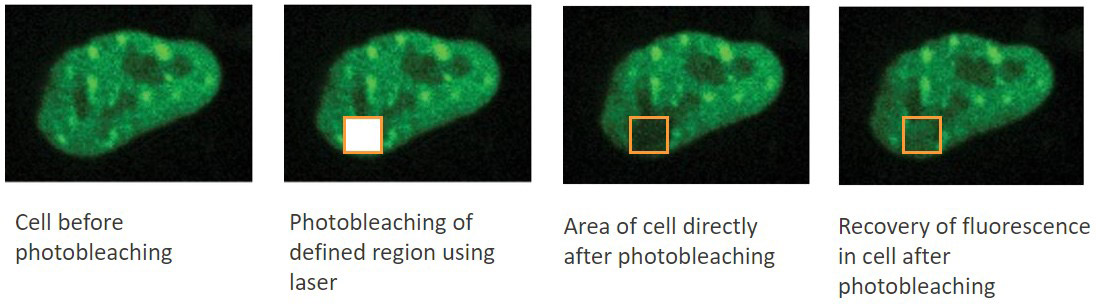
FRAP: Fluorescence Recovery After Photobleaching.
In this technique, a fluorescent label can be purposely photobleached in a defined area using high illumination. Measuring the diffusion co-efficient of non-photobleached fluorophores of within the bleached area delivers information of molecule dynamics. The diffusion speeds can be calculated from a diffusion equation.
This technique is used typically for studies of lipid bilayers i.e. cell membranes. Binding and interactions will impact the diffusion rate and so interactions as well as movement at this important cellular interface can be tracked over time. To get a further grasp of a FRAP in practice, check out the webinar: “Uncovering the Membrane Mechanism of Cytokinesis Using Live Cell Imaging and Subcellular Optogenetic Tools”
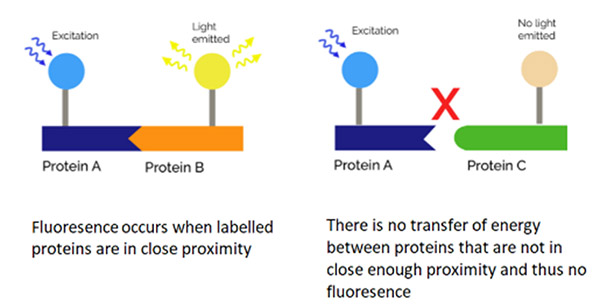
FRET (Förster Resonance Energy Transfer) occurs over short distances, typically within 10 nm, and involves the direct transfer of excited state energy from the donor fluorophore to an acceptor fluorophore as an alternative to fluorescence emissive decay from the donor. Upon transfer of energy, the acceptor molecule enters an excited state from which it decays emissively (always of a longer wavelength than that of the acceptor emission). By exciting the donor and then monitoring the relative donor and acceptor emissions, either sequentially, or simultaneously, one can determine when FRET has occurred and at what efficiency. Since FRET occurs at such short molecular distances, FRET is an ideal means to analyse protein-protein interaction that occur in this distance regime. For a given set of experimental conditions.
1) When there is no FRET detected, there is no molecular interaction between the proteins analysed.
2) If FRET is observed, the proteins can be shown to have an interaction
See an overview of microscopy solutions to FRET.
Green fluorescent protein (GFP) was the first fluorescent protein to be isolated from jellyfish and characterised. GFP protein emits a green light when excited with blue light, allowing the visualisation of fluorescence inside cells or tissues. Slight variations in the coding sequence of GFP can be used to modify the properties of the excitation and emission spectra and give rise to new variants of GFP. Some of the new options used in biological imaging include BFP (Blue), CFP (Cyan), YFP (Yellow), etc. Fluorescent proteins are widely used in microscopy as a reporter of expression to allow the investigation of the dynamic mechanisms in living cells, tissues or even in living organisms.
Advanced microscope systems often feature lasers - Light Amplification by Stimulated Emission of Radiation - as illumination sources rather than the metal halide or Xenon (found in basic microscopes). The reason for this is that lasers provide coherent light of defined wavelengths at high power densities making them very effective for several key applications involving fluorescence such as confocal, TIRF, FRET, or super-resolution (notably PALM and STED).
A microscopy system will require a number of lasers to allow illumination at the required wavelengths. Often microscopes use beam combiners or laser engines like an ILE which can combine multiple lasers. When higher power illumination is not required, e.g. general florescence imaging, LED light sources may be an alternative option.
LEDs (Light Emitting Diodes) have replaced the older generation of light sources used for brightfield and widefield microscopy, such as Metal Halide. LEDs are more efficient and offer stable output over a much longer lifespan. In microscopy applications, a LED light source will typically combine a bank of different LEDs in order to cover a broader range of excitation wavelengths from the UV through to the NIR. Although LED light sources are, the current choice for many regular live-cell imaging applications, some applications such as super-resolution techniques need higher illumination powers and thus lasers may be required.
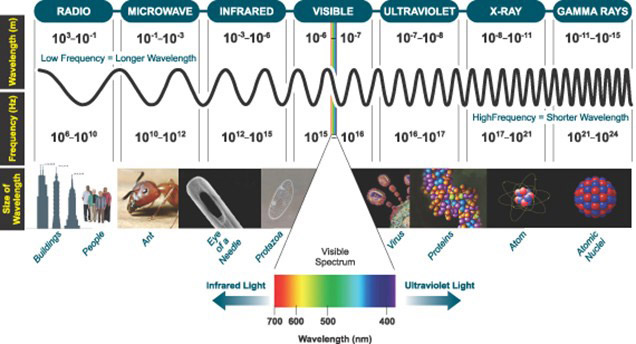
Light, or Visible Light, commonly refers to electromagnetic radiation that can be detected by the human eye. The entire electromagnetic spectrum is extremely broad, ranging from low energy radio waves with wavelengths that are measured in meters to high energy gamma rays with wavelengths that are less than 1 x 10-11 meters. In light microscopy, the wavelengths of light used range typically between 400-800 nm. This range of excitation wavelengths used is the basis of multiple microscopy techniques from the most basic brightfield through to a high-end super-resolution. Light sources, filters and dichroics can be combined to illuminate a sample: excite specific fluorophores and detect the emission of the corresponding protein. Read more about light in the article what is light.
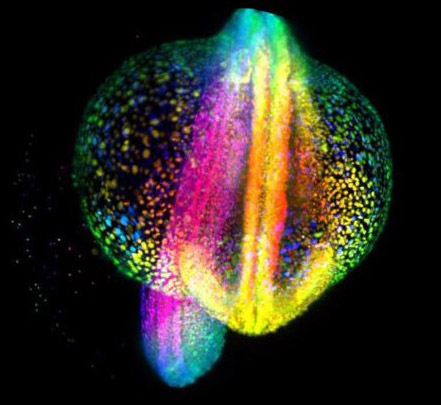
Lightsheet microscopy was used to image this developing Zebrafish embryo to provide a highly detailed 3D image.
Light-sheet microscopy presents a different strategy to illuminating the sample compared to confocal and widefield microscopes. In confocal and widefield microscopes, the sample is illuminated vertically, meaning that the light will excite the whole sample. For a light sheet microscope, the sample is illuminated with a thin sheet of light that is perpendicular to the objective that collects it. Since it is only a single plane of focus being illuminated, it reduces the phototoxicty and therefore makes it extremely applicable to in-vivo imaging.
There are many different types of lightsheet microscopes that have been developed to suit different samples or specific applications.
Light Sheet Fluorescence Microscopy (LSFM) is now an established technique for imaging three-dimensional biological samples, e.g. tissues, organoids and model organisms like Zebrafish.
Light sheet microscopy can also be known as SPIM – single plane illumination microscopy.
Some of the challenges of light Sheet microscopy include:
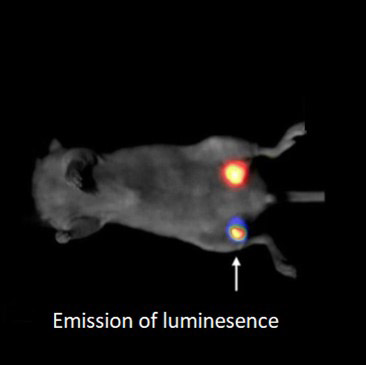
Luminescence is the spontaneous emission of light without the need of excitation light. Luminescence can persist for minutes or even hours without excitation light. (Fluorescence will cease after the excitation light is turned off.)
Advantages of bioluminescence are lower autofluorescence, lower scattering of excitation light, higher signal-to-noise image, and minimized photobleaching and phototoxic. In addition, bioluminescence allows imaging of biological phenomena over very long durations.
Importantly, luminescence signals are very weak, so to visualize the signals, the detector must have an exceptionally low dark current. The deep-cooled CCD cameras like the iKon-M have a very low dark current, with values that are orders of magnitude lower than the sCMOS cameras. For this reason, cameras like iKon-Mare perfectly suited for collecting signals over long durations of these experiments.
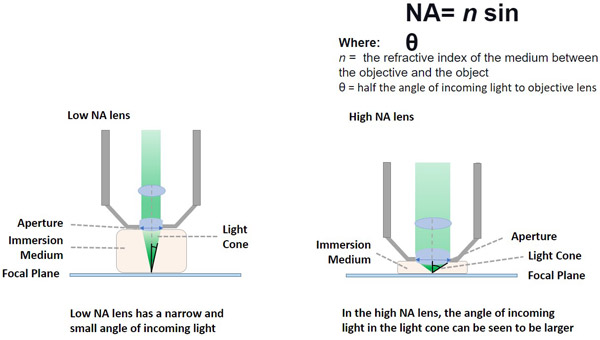
The numerical aperture (NA) of an objective lens is defined by the ability of the objective to capture a wider angle of rays of light. The higher the Numerical Aperture of an objective (NA), the higher the resolution that the objective can deliver. [Up until 250 nm - the diffraction limit of light is possible. See below in Resolution] The higher the numerical aperture, the lower the focal length of the objective.
The follow equation gives the NA: NA=n sin 0. In this equation n is the refractive index of the medium between the objective and the object. 0 is 1/2 of the angle of incoming light rays.
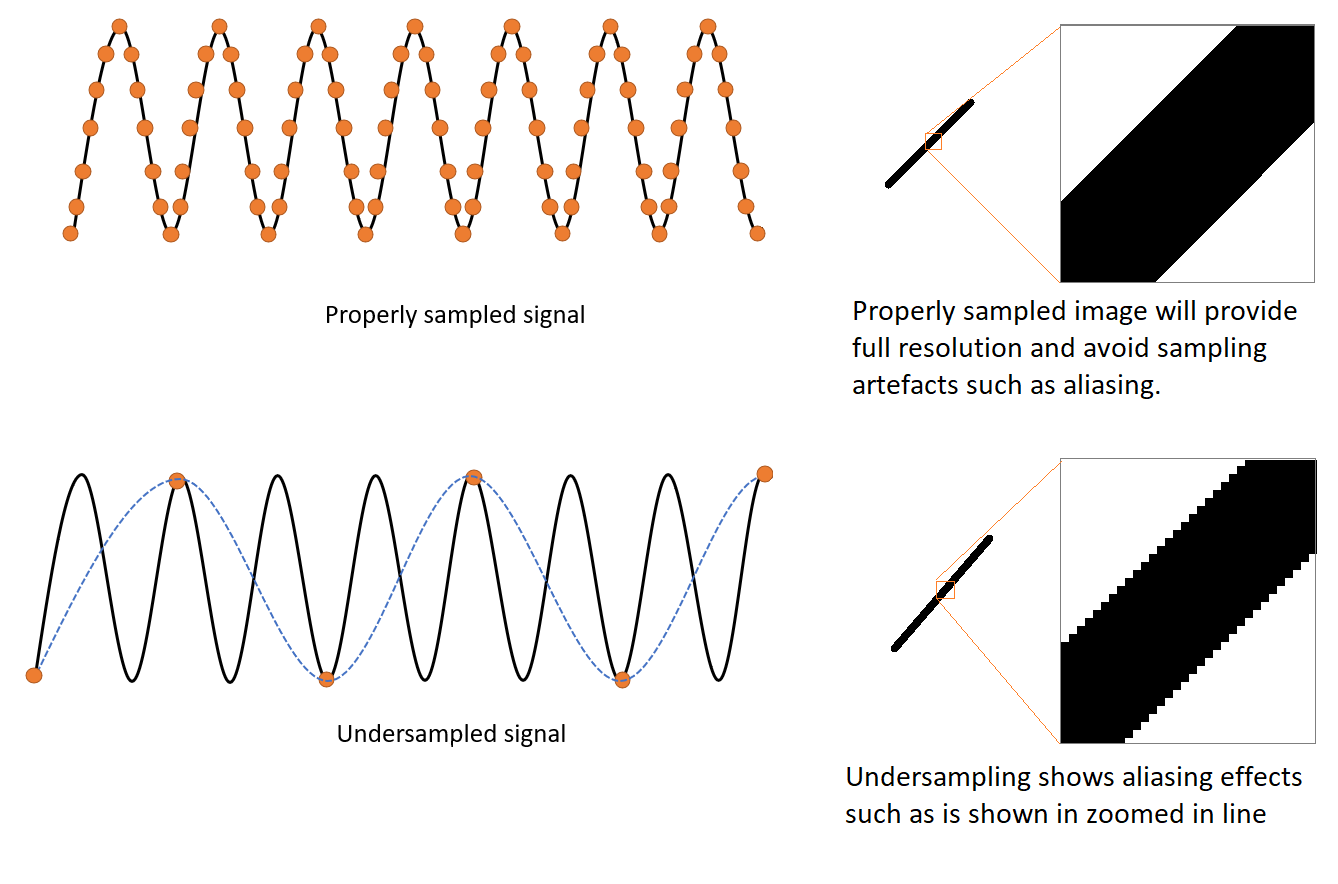
In microscopy, when acquiring an image, care should be taken to ensure that the detector (digitizer) can sample all the image details. Failing to adequately sample the object to be analysed will result in an image that does not represent the object correctly. Additionally, for structures with repetitive patterns, and in which the image is not acquired with the correct sampling density, an undesirable phenomenon named aliasing will appear.
The Nyquist-Shannon theorem defines the density (or frequency) of sampling required for acquisition at a defined magnification. To acquire the image of an object, the microscopist needs to cover with at least 2 pixels the details to be resolved in the image. When the sampling distance is larger than the Nyquist distance, information about the image is lost (under-sampling).Under sampling gives rise to unwanted Aliasing Artifacts.
Several options are available to acquire with Nyquist criteria. The choice of the microscope detector (which have different pixel sizes) and also of microscopes with extra magnification lenses will allow proper sampling of the microscope image.

This image represents the Nyquist-Shannon theorem and the sampling of a signal. In A), the digitized sampling frequency (yellow circles) is spaced enough so it can capture all the details in the signal. In B), the digitized sampling frequency is too (low) widely spaced and therefore, the image obtained does not represent the details of the sample.
When an object is imaged in light microscopy, the resulting image is degraded by a process named “convolution” which is a result of the optical properties of the system. This image degradation process can be restored by deconvolution.
The convoluted image arises from applying the PSF (intrinsic optical properties of the system) to all the infinitesimal points of the object. To perform the mathematical calculations to restore and deconvolve an image, (eg, restore the true image of the object) the microscopists use what is known as the OTF (Optical Transfer Function). In “Fourier space” any image can be converted to a sum of all its trigonometric functions (Sin and Cos).
In short, since:
Then, by using the OTF and applying it to the deconvolution algorithm, the image can be restored to the original condition.
Dragonfly confocal acquisition software has the option to allow on-the-fly deconvolution with ClearView-GPU based deconvolution making this useful function easily accessible.
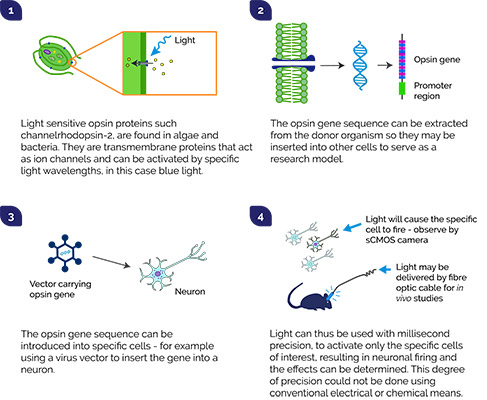
Optogenetics relates to biological techniques in which light can be used to activate, or modulate, genetically modified light-sensitive proteins. Using light pulses, researchers can manipulate specific cellular functions such as the activation of neurons, cellular morphogenesis, microtubule dynamics, etc. Andor mosaic is an ideal tool for optogenetics; it allows simultaneous and precisely controlled illumination of multiple regions of a specimen.

It can be observed that phase contrast imaging technique will deliver much more Resolution and contrast than Brightfield. In brightfield the cells are nearly transparent. In phase contrast both the nuclei and cytoplasm of the imaged cells can be clearly identified.
Phase contrast microscopy can be used to observe details within living cells that would not be visible using brightfield microscopy without the need for cellular stains. The phase contrast technique is based on phase shifts in light that occur as it passes through different mediums of cellular components. As light passes through one medium to the next the speed is affected relative to the difference in the refractive index of the two mediums. This creates a phase shift. By exploiting this principle, it is possible to boost the contrast of the image as this varies throughout the sample allowing different structures to be revealed.
Phase contrast was developed by Frits Zernike in the 1930s yet remains useful for cell biology studies today. Typical applications are for living cells, micro-organisms and thin tissue sections.
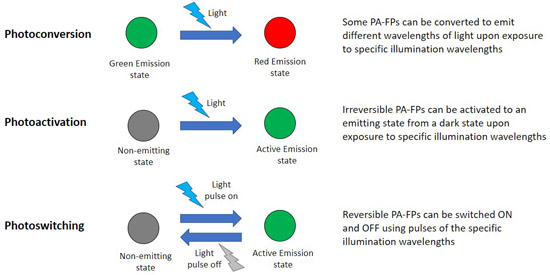
Photoactivatable fluorescent proteins (PA-FPs) are fluorescent proteins that can alter their emission spectrum when irradiated with specific wavelengths. There are different types of PA-FPs, ones that, when activated, can turn from one colour to another (ex. green to red) – named photoconvertible fluorescent proteins, or those that can change from dark state to an emitting fluorescent state.
Furthermore, Photoactivatable fluorescent proteins can be divided into two main categories: irreversible or reversible. Irreversible, PA-FPs can only change once from one fluorescent state to another. Reversible PA-FPs can be switched ON and OFF upon exposure to the specific wavelengths repeatedly (photo switching). Researchers have a selection of PA-FPs that are extremely well characterized. PA-FPs have many uses in microscopy; an example is the local activation of a protein and its subsequent time-lapse imaging using photostimulation devices such as an Andor mosaic.
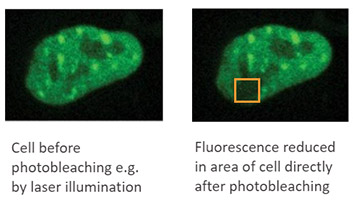
Photobleaching describes the process by which light used for illumination of a sample induces damage to a fluorophore so it can no longer fluoresce. When given suitable illumination, fluorophores can be excited to emit light many times. When a fluorophore is excited, the molecules go into a high energy level called the singlet state. Excited molecules can then return to the ground state and release a fluorescent signal which can then be detected as the emission wavelength. However, if the excitation intensity is too high, for example, using high laser powers, the excited molecules can go to a reactive triplet state that can interact with other components in proximity to the fluorophore. The molecular structure is altered, and as a result, the fluorophore can no longer return to the ground state. – The sample is bleached i.e. photobleached.
To minimize photobleaching, researchers should: reduce the intensity of illumination and keep exposure times to a minimum. The use of sensitive detectors helps to minimize photobleaching.
An application that uses photobleaching to the researcher's advantage is FRAP – Fluorescence recover after photobleaching.
When excited under illumination, fluorescent molecules react with molecular oxygen to produce free radicals that can damage macromolecules. This can cause cellular death or have subtle yet significant effects on cell physiology.
Therefore, it is important to look for ways to minimize phototoxicity. Measures to minimize phototoxicity include 1) ensuring that the sample is only illuminated when acquiring the image, 2) use microscopy techniques that limit illumination to the focal plane, 3) use longer wavelengths to excite the sample (lower energy) and 4) use of high sensitivity detectors to allow shorter exposures and illumination powers.

The sensor of an imaging camera has many pixels that act to collect the signal in the form of photons. The photons are converted to an electrical signal and digitized so that an image may be recreated.
A pixel is the smallest unit or picture element possible for digital devices such as a display monitor or a sensor. In the case of sensors with many millions of pixels, each of these pixels can convert light to an electrical signal. The signals from each pixel can be reconstructed digitally to recreate the original image.
The pixel size is especially important – while a smaller pixels allows the optical system to maximise resolution, a larger pixel gathers more light and thus allows a better signal to noise ratio. Therefore, there can be some compromise over pixel size depending on the application needs. The range of pixel sizes in modern sensors used for microscopy is 4.5 to 16 µm.
The pinhole is an essential part of the confocal microscope, allowing the microscope to deliver optical sectioning. Confocal microscopes are designed to acquire multiple optical slices in a sample. The optical slices capture the in-focus light and discard the out-of-focus light. The pinhole is an aperture in the light path before the detector that ensures the optical sectioning allows the in-focus light to reach the detector and discards the out-of-focus light.
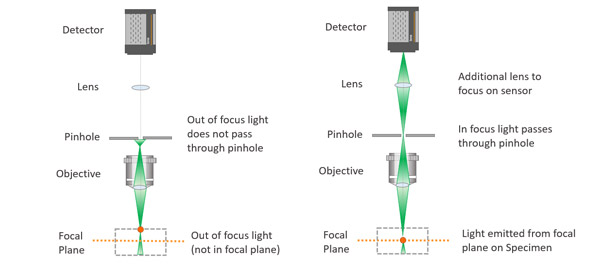
Image of light passing through a single pinhole.
Confocal microscopes record an optical slice of a 3D sample as an image. Ideally, the optical slice will record only the in-focus light that illuminates the sample. To capture only the in-focus light confocal microscopes work by having a pinhole within the light path that allows the passage of in-focus light to illuminate the sample. The out of focus light is discarded.
For Point scanner confocal microscopes, a single pinhole will scan the sample point-by-point for every optical slice. It's therefore not surprising that acquiring large 3D volumes with point scanner confocal is time-consuming. The alternative to point scanning confocal that delivers the optical sectioning with the benefit of much higher throughput are spinning disk microscopes or multipoint confocal.
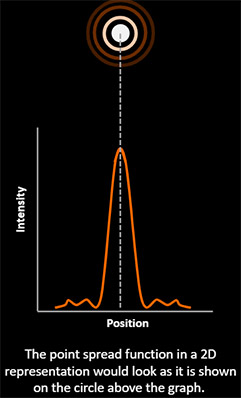
The PSF - Point Spread Function - is the response of an imaging system (e.g. a microscope) to a point object. When light passes through an optical system (lens and other imaging components) is distorted due to the properties of the optical systems. The PSF is a measure of such distortion.
If an infinitesimal point does not appear as a point the image will be blurred. The resulting image is said to be convoluted. Since the PSF is the same in all imaging space (e.g. in all the object to be imaged) it can be used in a mathematical process to revert the blur – this process is named deconvolution. Deconvolution will remove the “fog from the image” revealing the detail of the real object. Andor confocal systems have the option to allow for easy to use on-the-fly deconvolution called ClearView-GPU based deconvolution.
The QE (Quantum Efficiency) is a measure of how efficient an imaging sensor is at converting the signal in photons into electrons. A QE of 80% would mean than for a signal of 100 photons, 80 of these would be converted into electrons and thus an electric signal by the sensor. QE is wavelength dependent as different coatings on the sensor and the nature of silicon will make it more or less efficient at different wavelengths.
Most sensors are configured for optimal QE in the visible range with additional options sometimes available that allow improved response in the UV or NIR range if it is needed. Back-illumination is used in modern sCMOS and EMCCD cameras to achieve high QE of up to 95%.
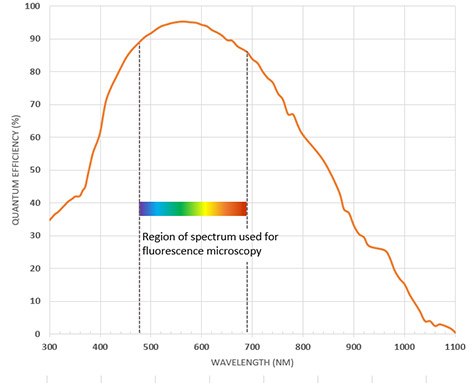
A Quantum Efficiency (QE) profile for a back-illuminated sCMOS camera with high QE in the region required for fluorescence microscopy.
Modern Imaging cameras have very low noise to help provide the cleanest image possible. In the image shown, the effect of lower read noise (right) is compared with that on the left with higher read noise.
Read noise is an important noise parameter of imaging cameras. Noise is created by the camera circuitry during the readout process. Read noise is the main noise component of the camera at short exposures used for live cell imaging. Read noise is inherent to the design of the sensor. Modern scientific imaging sensors such as sCMOS have very low read noise approaching 1 electron which is a significant improvement on older technologies such as CCD cameras.
When a ray of light passes from one medium to another with a different density, there is a change in speed and direction of light - this is termed refraction. If light passes from a fast medium (less dense) to a slow medium (more dense) it will bend toward the normal. And away from the normal when passing from a slow medium to a fast medium. The amount of bending that occurs depends on the indices of refraction (i.e the density) of the two media involved. This is described quantitatively by Snell's Law.
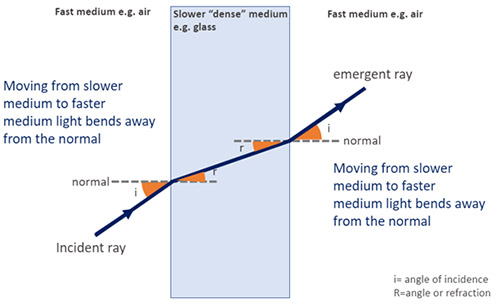
This effect can be harnessed in microscopy e.g. as the basis of TIRF. Learn more about TIRF in the Andor Microscopy School.
Learn more about refraction in the Andor Microscopy School.
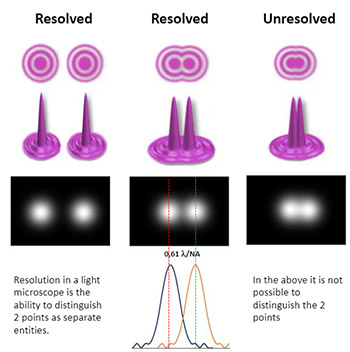
In microscopy terms, resolution describes the ability of the microscope to distinguish details in the image. More specifically the minimum distance that two distinct points are able to be observed as separate objects. The resolution of the microscope does not get better due to a higher magnification (which is a common misconception) but rather by specifications of the objective. The resolution of the microscope (R) is defined by the numerical aperture (NA) of the system and the wavelength of light used during imaging (λ).
Resolution (r) = λ/(2NA)
Therefore, with higher NA and shorter wavelengths used, the higher the image resolution can be and the more detail we can see. Normal light microscopy delivers resolutions down to 250-300 nm. “Super-resolution” light microscopy techniques have been developed that can exploit properties of light and achieve much greater resolution with the ability to resolve objects down to 20 nm or even better. Learn more about resolution and super resolution here.
sCMOS (scientific complementary Metal Oxide Semiconductor) is a sensor technology used for scientific imaging cameras. sCMOS cameras were first introduced in 2010 and have since become the most widely used scientific imaging cameras used for microscopy. This was due to their superior speeds, larger sensors, low noise and wide dynamic range compared to interline CCD cameras used at the time. sCMOS cameras are called active pixel sensors since each pixel operates with its own amplifier circuit. This allows them to run at higher speeds than CCD cameras which operate in a pixel-by-pixel serial manner. The first commercial sCMOS camera was the Andor Neo camera, which was followed by the Zyla series and most recently the back-illuminated Sona series.

Light spectrum is the range of wavelengths produced by a light source. White light has a broad range or “spectrum” of light composed of many light wavelengths. The human eye can see wavelengths within the visible spectrum within the range ~380 to 750 nm. For fluorescence microscopy, the spectrum of light used to visualise the samples is selected by using filters and dichroics that allow the passage of a set of wavelengths and exclude wavelengths above or below a defined value.
In microscopy, the supporting microscopy system and cameras need to be optimised for working at different regions of the light spectrum. Often the transmission of light at either end of the light spectrum is reduced. If researchers want to use wavelengths into the extremes of the spectrum, they should choose a detector that can capture the desired wavelengths. Cameras such as the iXon EMCCD camera have sensor coatings that provide extended response in the NIR and UV regions.

SPIM (Single Plane illumination Microscopy) is a fluorescence microscopy technique that uses a focused “light-sheet” to illuminate the specimen from the side. For this reason, it is also referred to simply as “light-sheet” microscopy. In SPIM, the optical sectioning will illuminate the desired optical plane to be imaged. Therefore, the optical sectioning reduces the exposure of out of focus areas of the sample to unwanted illumination. For this reason, phototoxicity and photobleaching effects can be reduced. SPIM can be used to scan larger model organisms quickly.
However, there are challenges with SPIM including:
Learn more about SPIM / Light sheet microscopy applications.
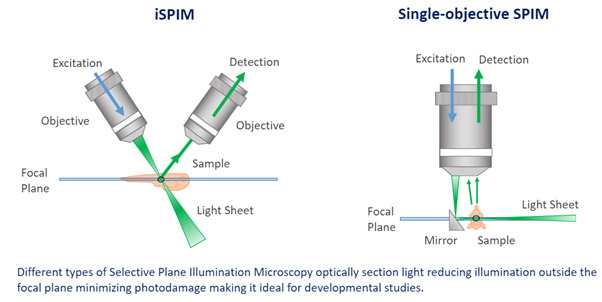
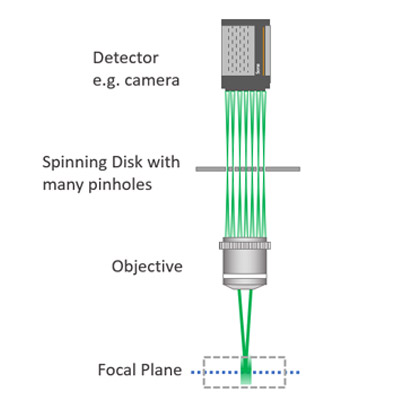
Image of light passing through a confocal spinning disk system.
A confocal microscope allows the acquisition of optical slices in a sample. The optical slices recorded will capture the in-focus light and discard the out-of-focus light. By only capturing the in-focus light, the Signal to Noise Ratio of the image will increase as well as its resolution. In Point scanner confocal microscopes, a single pinhole will scan the sample point-by-point for every optical slice.
A spinning disk microscope, also known as multipoint confocal, has a disk with multiple pinholes which simultaneously screen the sample in a single instant. Using this method of a multiple pinhole disk, spinning disks deliver a confocal image instantly; Andor Dragonfly is an instant confocal imaging system. Learn more about multipoint confocals - spinning disks .
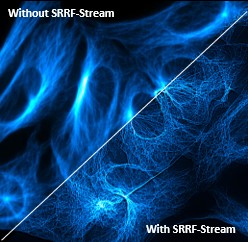
Super Resolution Radial Fluctuations “SRRF” is a super resolution technique that is based on localizing the natural fluctuations of fluorophores over time. A development of this technique is SRRF-Stream+. This version optimizes GPU processing and allows simultaneous acquisition and processing. With SRRF-Stream+ real-time super resolution for live cell imaging is possible.
SRRF-stream+ is a low-cost camera-based method to achieve super-resolution and can deliver 100 nm of lateral resolution. Higher resolutions are possible depending on the imaging conditions. It does not require complex sample preparation and can deliver super-resolved images deep inside cells and tissues. The improvement in resolution of SRRF-Stream+ is comparable with that achieved using SIM, however SRRF-Stream+ delivers a much easier and more-affordable camera-based mechanism to achieve improved resolution for an existing system, where the camera can be swapped out, or built into a new system.
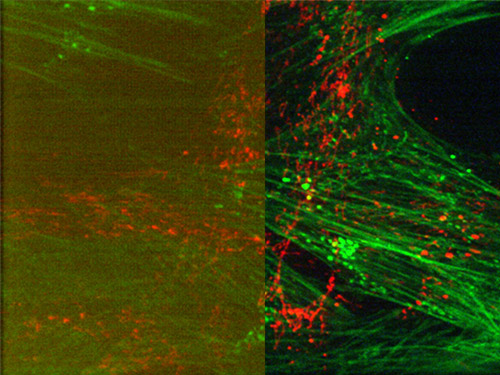
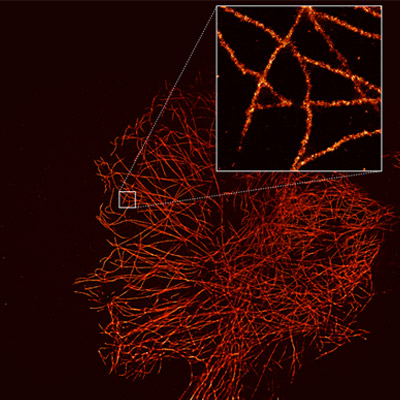
STORM (bottom right) and TIRF (top left) images of labelled vimentin intermediate filaments in a HeLa cell. Images were acquired using iXon Ultra 888 installed a custom-built super-resolution microscopy system. Courtesy of David Virant & Ulrike Endesfelder, Endesfelder lab, MPI Marburg in cooperation with Rothbauer lab, Tübingen University, Germany
STORM (Stochastic Optical Reconstruction Microscopy) is a widefield technique and can also be combined with TIRF illumination to provide super resolved images of intracellular structures. SMLM (single molecule localization microscopy) techniques (STORM and PALM) deliver the highest resolution of super-resolution technologies typically achieving up to 10 nm laterally. STORM uses the principle of fluorophores “blinking” between their dark state and an emission state, then returning to a dark state. This information from many emitted photons (of the excited fluorophores) is reconstructed using the Gaussian based localisation of photons. The reconstruction will generate a super-resolved image.
For STORM to work effectively, to allow for reconstruction of the super-resolved image, the fluorophores must have a low density. That is to say that only one fluorophore should be activated at a time within a diffraction-limited area. STORM delivers very detailed information on cellular components. Still, this powerful technique is not well suited to live cell imaging due to phototoxicity from high illumination intensities involved.
3D STORM exploits the properties of an astigmatic lens to create a distortion in the PSF. The PSF distortion can be used to infer axial localization over an 800 nm range.
Using an astigmatic lens in the light path, the PSF will be distorted differently in the X and Y direction, and these PSF distortions, once calibrated, will allow the user to retrieve 3D information of the dSTORM image.
Dragonfly supports an astigmatic lens and, as such, can be used to acquire 3D-SMLM data.
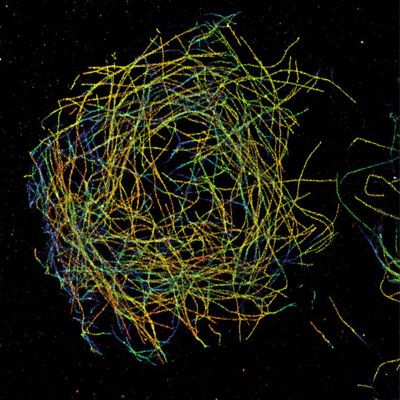
3D STORM image of microtubules in a Drosophila S2 cell imaged using iXon EMCCD Camera. A colour scale depicts the Z dimension of the dataset. Courtesy of Prof. Bo Huang, UCSF.
This development of STORM allows for study of 3D morphologies with lateral resolutions of 20-30 nm and axial resolution around 50-60 nm.
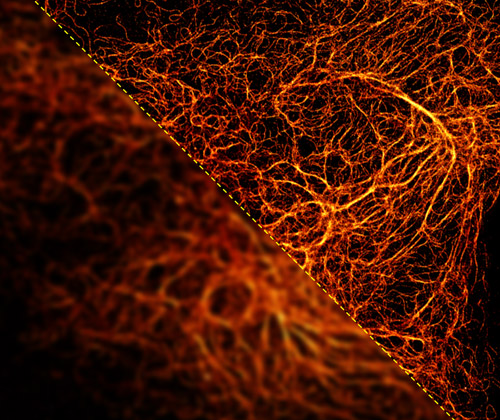
A super-resolution image can reveal the highly detailed structures within cells, such as microtubules. dSTORM image captured with the iXon Ultra 888. Courtesy of Alan Lowe & Ricardo Henriques, UCL
Normal light microscopy is limited to a resolution of 220 nm, which means that any structure to be imaged that is smaller than 220 nm will not be resolved. The limit is set by the wavelength of the light and the Numerical Aperture of the microscope objective (see Resolution in Numerical Aperture). Improved resolution can be achieved by using electron microscopy, which provides exceptional resolution of cell structure. However, electronic microscopy is not suited to many cell biology studies and is incompatible with live-cell imaging. Super-resolution in light microscopy refers to a group of technologies that have allowed microscopists to use fluorescence light microscopy and acquire images in which the diffraction limit of light was overcome, allowing insights into structures smaller than 220 nm. Examples of super-resolution microscopy technologies include STORM, PALM, STED, SIM and SRRF; and also, a protocol based approach: Expansion Microscopy.
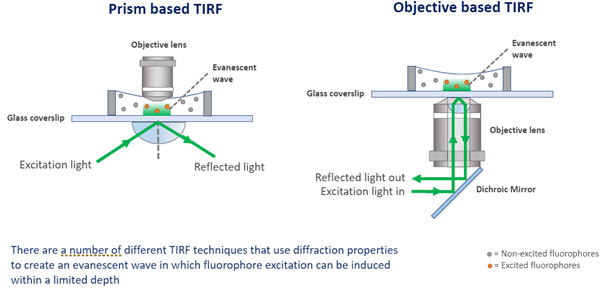
TIRF - Total Internal Reflection Fluorescence Microscopy is a technique that delivers very detailed images of an object at the cell surface, up to 100-200 nm depth inside the sample. TIRF exploits the optical effect at the interface between two optical media that have a different refractive index. [The refractive index of the medium where the sample is and the refractive index of the glass slide.] TIRF collects the light that illuminates the boundary between both mediums with a total internal reflection angle.
To achieve TIRF, microscopes are built with obstacles on the light path in such a way that will force the light to reach the edge of the slide at TIRF angle. TIRF is the ideal solution to analyze the important cellular events at the cell membrane boundary, such as, membrane dynamics, endocytosis, exocytosis, etc. TIRF is also a valuable technique for illumination in Super-resolution microscopy techniques of Single Molecule Localization Microscopy (such as dSTORM). Andor Dragonfly can deliver TIRF imaging. Learn more about TIRF.
There are multiple applications of uncaging; the paper "Discover how Uncaging Helps Reveals Calcium's Role in Cell Cycle Progression" is an excellent example of such.
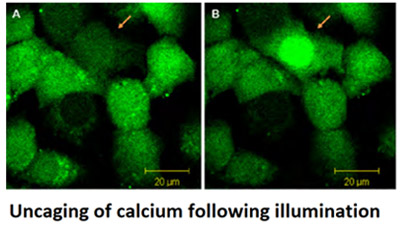
Uncaging refers to the process of activating inactive biomolecules ("caged"). The molecules are activated using light (photoactivation). A molecule, when caged is inactive due to chemical constrictions. By using light to break the chemical constriction (the covalent bound of the protecting compound), the biomolecule will become active and so uncaged. Uncaging is typically done using optogenetics tools to allow precise control of illumination and activation of the biomolecules within specific cell locations and at exact time points.
A group of images that represent an object is said to be undersampledwhen an insufficient number of images is taken to reconstruct the original signal. The result is that it lacks spatial resolution and thus lacks details that are present in the original specimen. To properly sample an object, the image acquisition should obey Nyquist sampling criteria. The Nyquist Criteria states that, in order to maintain the spatial resolution in a digital image, the sampling interval must be at least 2.3 times smaller than the highest spatial frequency of the specimen to be imaged. For digital imaging, this means that the pixel size must be small enough so that features on the images are covered by at least 2 pixels.
In practical terms, this means that:
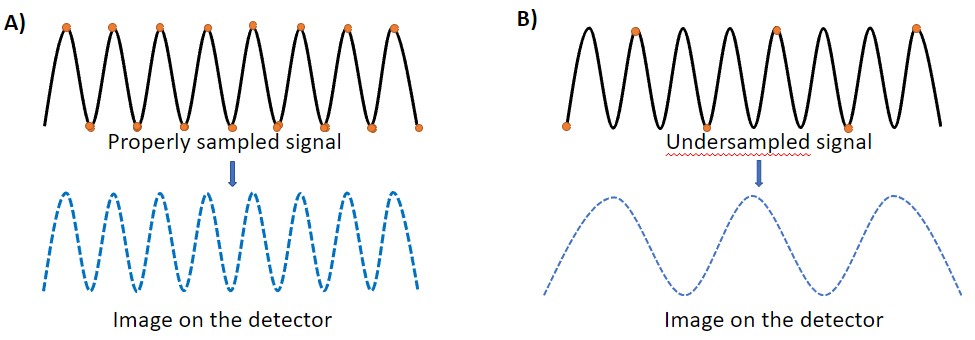
This image represents the Nyquist-Shannon theorem and the sampling of a signal. In A), the digitized sampling frequency (dots) are spaced enough so it can capture all the details in the signal accurately. In B), the digitized sampling frequency is too low and cannot capture the signal accurately. The image obtained is thus not accurate to the original.
Widefield microscopy such as for this fluorescence image has many applications and suited to many conventional microscopes. This example shows the blurred effect that can start to become a problem especially for thicker samples.
Widefield microscopy is one of the fundamental techniques of microscopy and is suitable for many applications. In a widefield microscope the whole specimen is illuminated using a light source. Brightfield microscopy is one form of widefield microscopy in which the entire specimen is illuminated by white light e.g. LED source either from above the specimen (inverted microscope), or below (upright microscope). Epifluorescence is another type of widefield that applies the illumination as a defined excitation wavelength with the emitted light of another wavelength returning to the camera. Widefield also describes DIC and other phase contrast techniques. Widefield techniques offer many benefits such as ease of use, low illumination powers, non-specialised microscopes and can suit many applications. A disadvantage with all widefield techniques is that the full specimen is illuminated, this can result in a blurred image, especially if the sample is thicker. To obtain a higher clarity of image another technique is required such as confocal microscopy. Normally this means moving to a different microscopy system, however the Dragonfly system allows users to perform confocal, TIRF and widefield modalities from the one system.
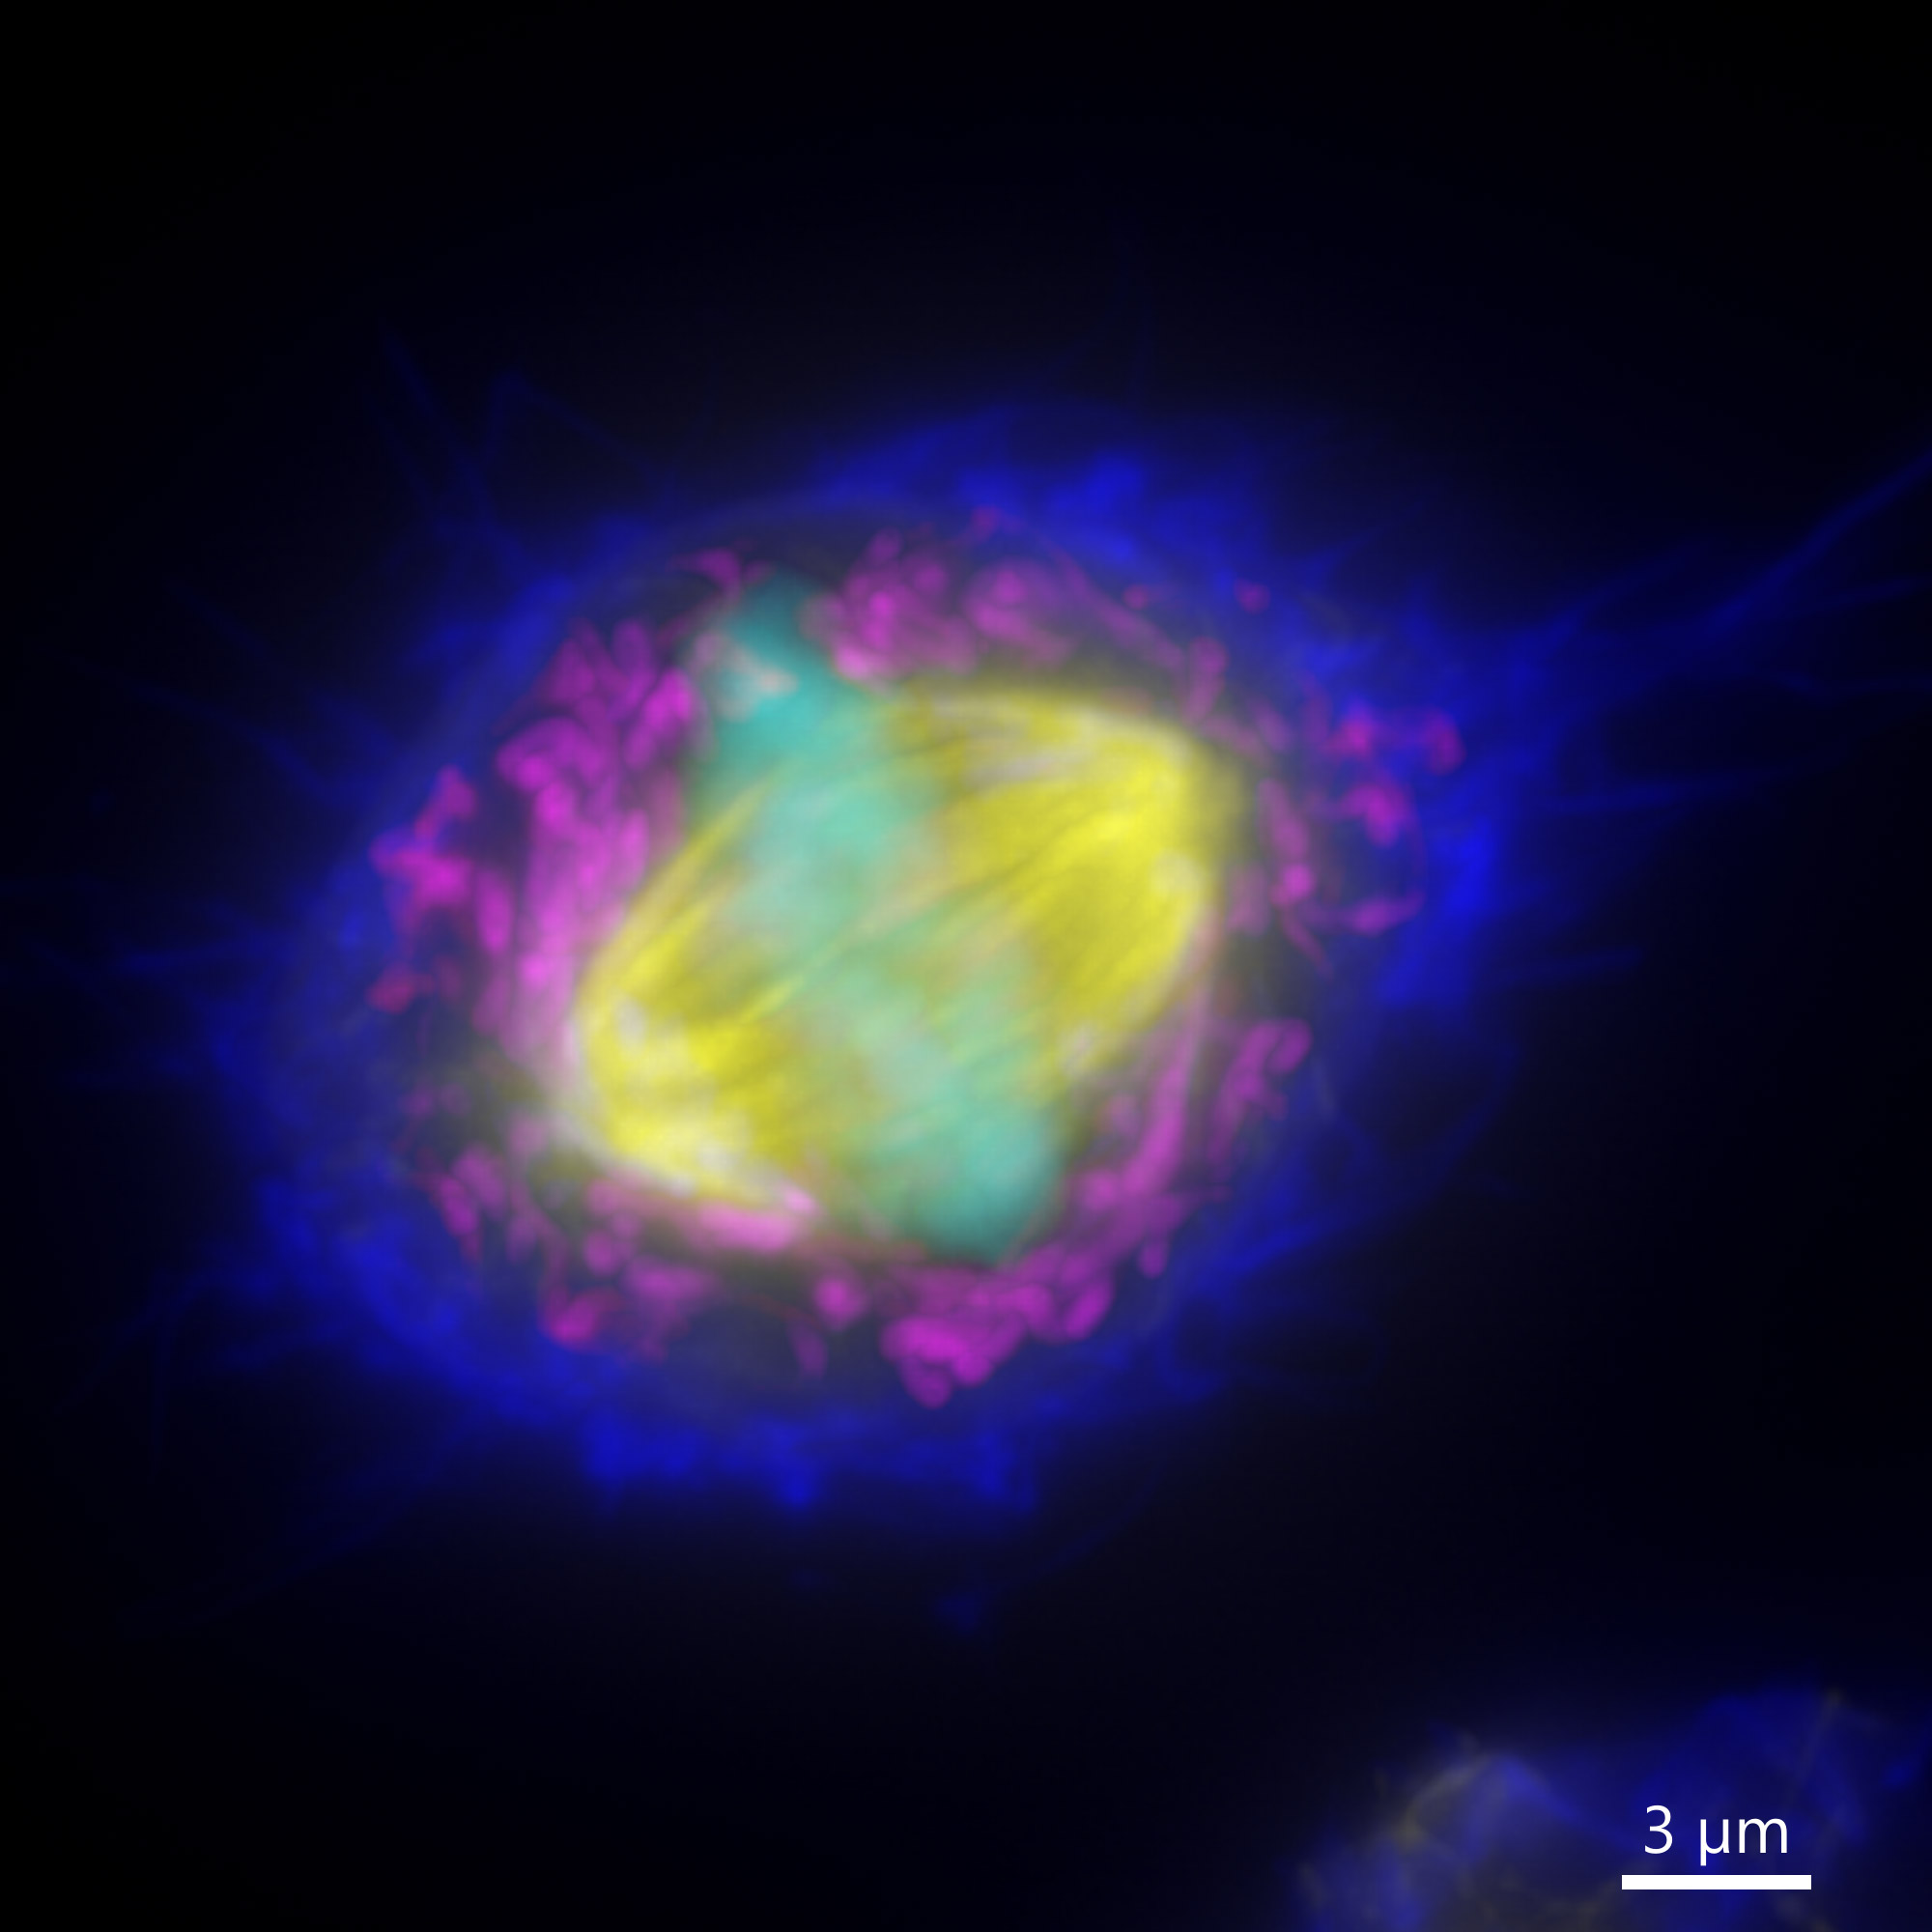
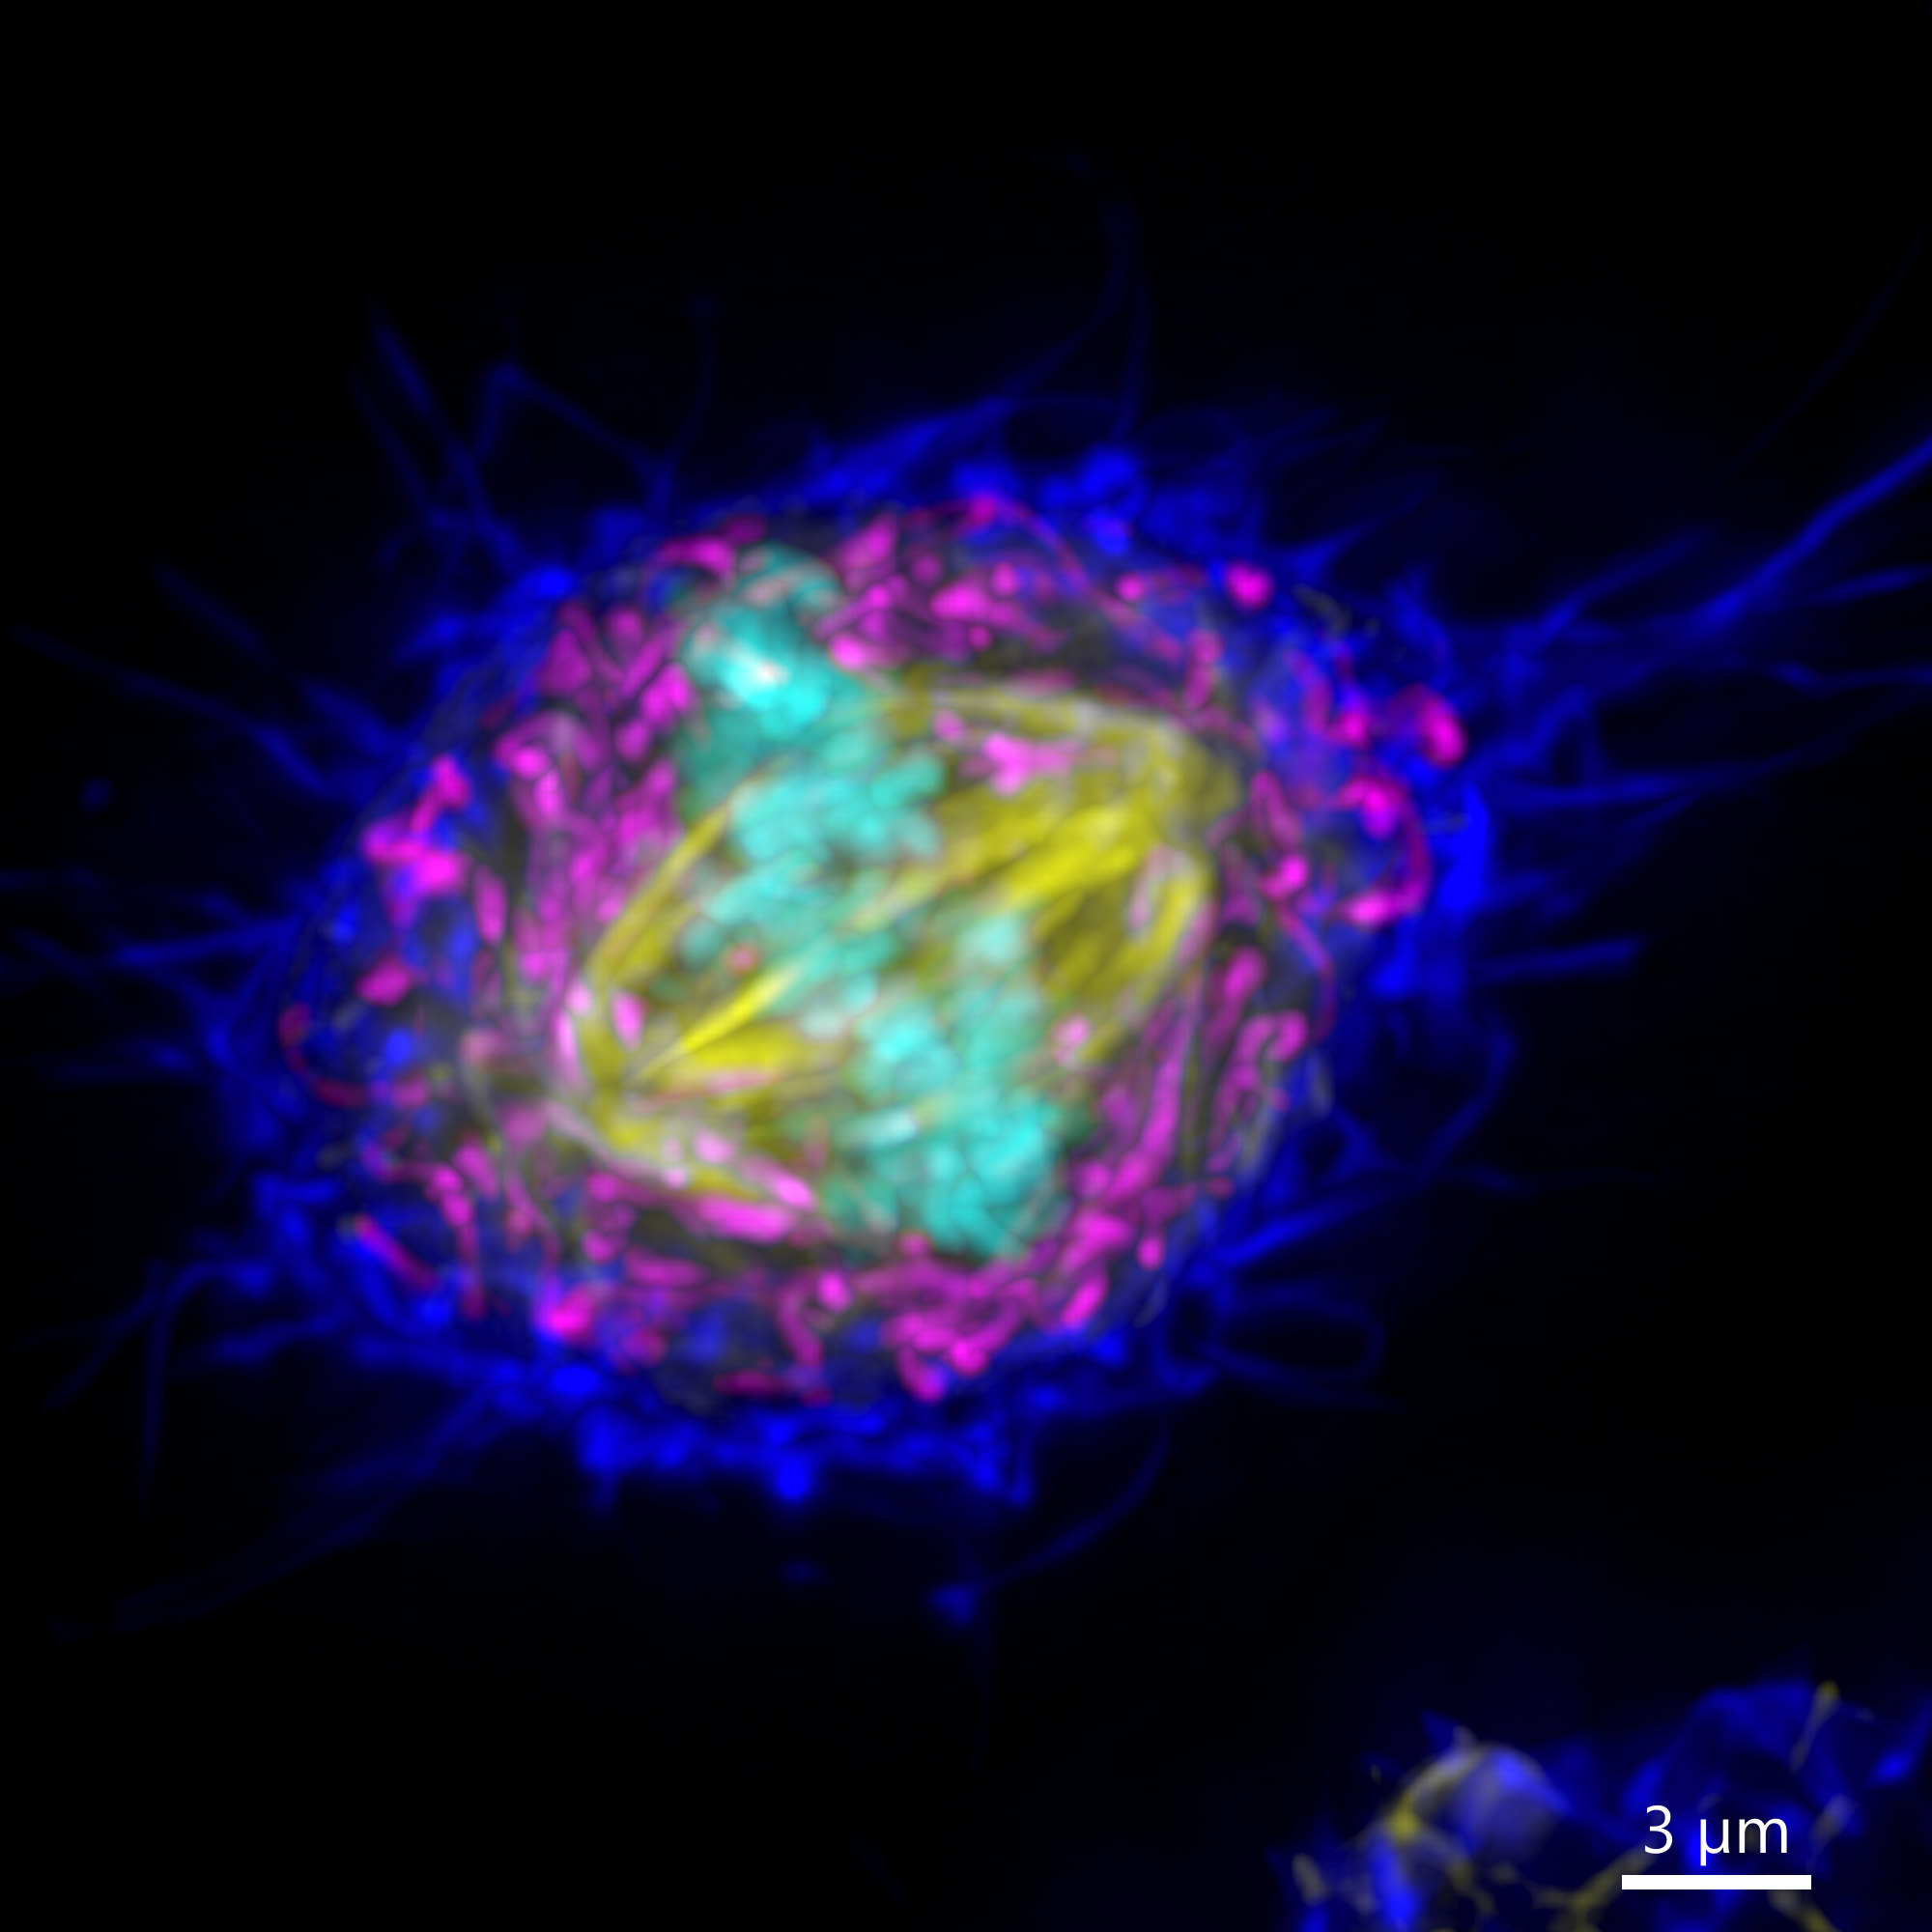
The resolution in Z is often called the axial resolution. Axial resolution is the resolution in the Z plane. The axial resolution is given by a different formula than the lateral resoltuion in a microscope. The lateral resolution is inversely proportional to the NA of the objective, whereas the Z (axial) resolution is inversely proportional to the squared numerical aperture. When acquired with low axial resolution (under sampled in Z), an image will not show all the details in all the imaging planes (XY, XZ, YZ) and therefore will not correctly represent the object.

Image shows two MIPs of the same cell acquired with different axial resolution. Image 1 was captured with Nyquist axial resolution, so all the detail of the spindle are visible in XY and highlighted in XZ and YZ. Image 2 was acquired with sub optimal axial resolution. In XY there are lesser detail in the MIP, and the lack of information is dramatically shown in the XZ and YZ projections

© Oxford Instruments 2026
