Resources
 Part of the Oxford Instruments Group
Expand
Collapse
Part of the Oxford Instruments Group
Application Notes
Author: Indrek Jõgi & Peeter Paris, University of Tartu, Institute of Physics
Published: 01 Oct 2025 · Last updated: 11 Nov 2025
Laser-Induced Breakdown Spectroscopy (LIBS) is an innovative atomic emission spectroscopy technique that enables real-time, in-situ elemental analysis of surfaces in harsh environments, making it ideal for applications in fusion research and nuclear science. In particular, LIBS has become a promising tool for fuel retention measurements in fusion reactors, where detecting and quantifying hydrogen isotopes e.g. deuterium (D) and tritium (T) retained in plasma-facing components is critical for compliance with nuclear safety regulations and understanding fuel recycling and wall interactions. Integration of LIBS with a robotic manipulator gives a flexible system capable of scanning reactor walls, divertor tiles, and other components without dismantling them from the reactor. This allows for remote diagnostics in the hazardous and inaccessible environment of a reactor, increasing both safety and data fidelity.
LIBS works by focusing a high-energy laser pulse onto a sample surface, creating a transient plasma plume which emits light at characteristic wavelengths corresponding to the elements present in the sample.
The spectral distinction between hydrogen isotopes requires rigorous optimization of the LIBS measurement setup because of the narrow wavelength difference of the isotopes (0.06 nm between T and D and 0.18 nm between D and H). The Stark broadening of the lines is the main broadening mechanism in the case of LIBS plasma. Signal optimization strategies—such as adjusting ambient pressure and detector settings—enhance sensitivity to low-concentration isotopes and improve repeatability across diverse surface conditions. Altogether, this approach supports long-term fusion operations by providing actionable insights into fuel retention and material migration.
The LIBS setup used for the basic studies of LIBS plasma plume development and optimization of LIBS conditions is depicted in Figure 1. Prior to each experiment, the vacuum chamber was evacuated to a base pressure of 10-3 mbar and then filled with N2, Ar, He gases with purity class 5.0 to the desired pressure in the range of 4 to 1000 mbar. The Mo target with H as the impurity was mounted on a motorized X-Y translation stage.
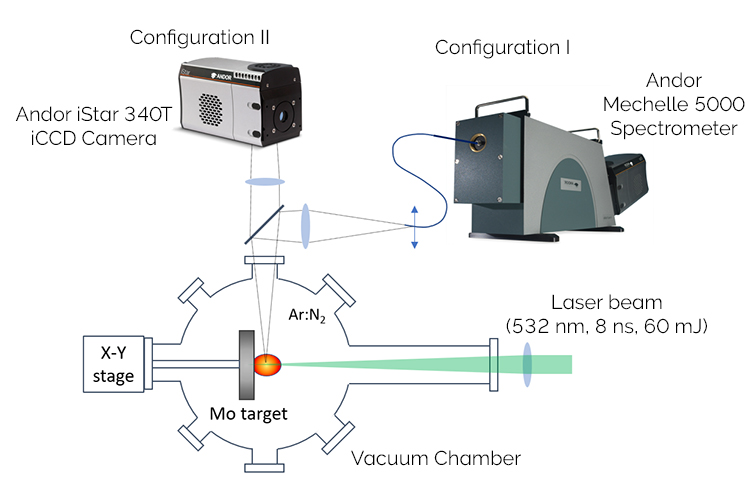
Figure 1. Schematic description of experimental setup. Configuration I is used for the acquisition of spectra and Configuration II for plume photos.
The LIBS studies used a Quantel YG981C Nd:YAG laser with 8 ns pulse length working at the second harmonic at 532 nm. The laser beam with the intensity of 60 mJ was focused perpendicularly to the target by a lens with 150 cm focal length. The approximate diameter of the crater formed by laser ablation was 0.7 mm and the fluence was 15 J/cm2.
The spatial and temporal evolution of the optical emission of the plasma plume formed by laser ablation was investigated using several different configurations. The photographs of the plasma plume were obtained by using the Andor iStar 340T ICCD camera, which collected the light perpendicularly with the laser beam (Figure 1, Configuration II). The two-dimensional 1:1.3 image of the plume was obtained by using a glass lens with a focal length of 200 mm. The second configuration was used to get the spatial distribution of the spectra along the axis of plasma plume development perpendicular to the Mo target. The emission of plasma was then focused onto the entrance end of the fiber by the lens and then guided to the Czerny-Turner type spectrometer coupled with the same Andor iStar ICCD camera.
The experiments with a sample simulating the H isotopes and W co-deposits on divertor tile used a 3.9 μm W coating with a nominal concentration of 10 at. % deuterium and 5 at.% nitrogen (N) on the Molybdenum (Mo) substrate. Nitrogen was added because it is expected to be found in the co-deposits when nitrogen seeding is used. The samples were transported in open air and therefore also contained an unknown amount of H originating from water vapors. In these experiments, an Echelle type Andor Mechelle 5000 spectrometer was used to obtain spectra in a broad wavelength range and determine also other elements. The previously described spectrometer configuration with a Czerny-Turner type spectrometer and an Andor iStar ICCD camera was used in parallel to separate the hydrogen isotopes.
According to the photos shown in Fig. 2, the LIBS plume development was similar in Ar and N2. At low pressures, the plume expanded until the intensity of plasma plume radiation was diminished, while at higher pressures, the plume reached a certain distance and only then diminished. The intensity was about two times stronger in Ar.
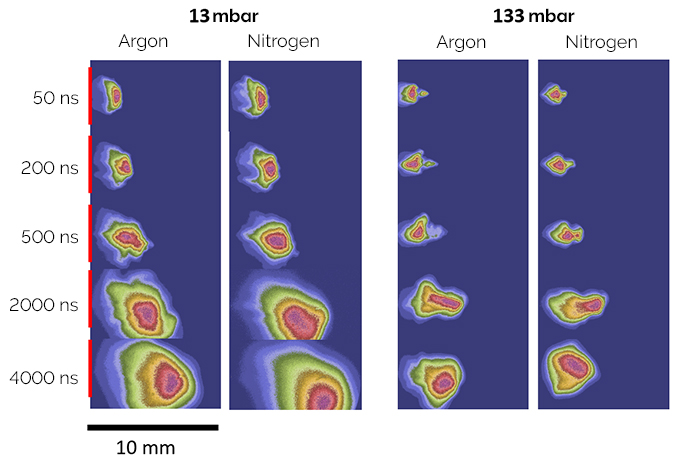
Figure 2. Photographs of the plume development in Ar and N2 gas at different pressures. The red line marks the position of the sample.
The knowledge of plume development also gives essential information for the optimization of the LIBS measurements in regards of the collection of plume emission. At low pressures, the size of the plasma plume grows to the order of tens of millimeters. With the typical size of the collecting fiber of the order of 1 mm, the magnification has to be 10:1 to collect most of the emission to the spectrometer. In the case of high pressure, the plume dimensions grow only to a few millimeters and the magnification can be considerably smaller.
The spectrum in the narrow wavelength range of 646 to 666 nm is shown in figure 3. The spectra are obtained at two different distances, 2 mm and 6 mm from the target. Close to the target, the Ha line dominates and the intensities of other lines are near the noise level. Farther away from the target, the Ha line diminishes and the intensity of Mo lines increases.
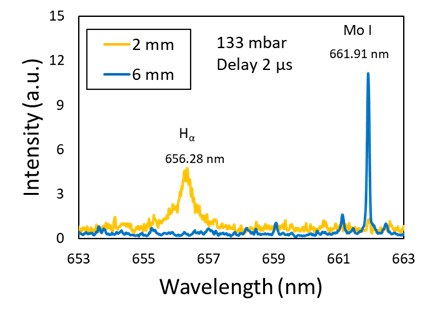
Figure 3. LIBS spectra obtained at two different distances at 133 mbar Ar.
The spatial development of plasma plume intensity is shown in figure 4. The upper panel shows the Ha line at 656.28 nm and the lower panel the Mo line at 661.91 nm. For all gases used, the distribution is clearly different for H and Mo lines. Ha line is more intense near the target, while Mo line is more intense farther away from the target. In addition, the Ha line intensity decreases much faster in N2 and Ar than in He. The development is also different in different background gases. He results in the largest plume, while N2 has the shortest plume. He allows us to obtain H for the longest time and also in the largest region of the plume. Therefore, He is most beneficial for the H isotope measurement, but it is not usable when LIBS is also used for the He detection.
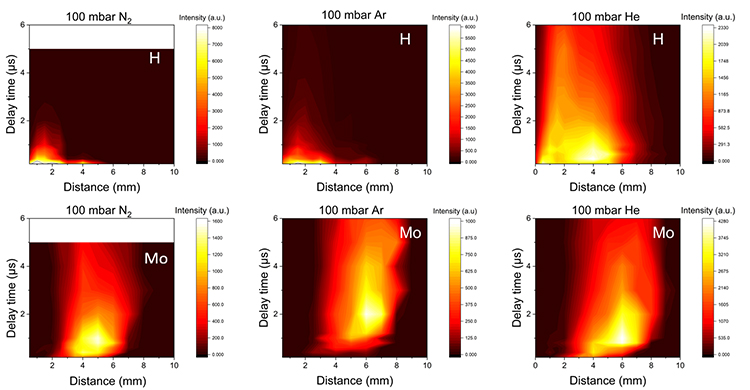
Figure 4. Heat maps of the spatial and temporal development of Ha line at 656.28 nm (upper panel) and Mo 661.91 nm line (lower panel) in N2, Ar or He gas environments at 100 mbar.
The experiments with a sample resembling W co-deposit on divertor tile in the case of nitrogen seeding were carried out at a lower pressure of 13 mbar to obtain good intensity and narrow H isotope lines. Andor Mechelle 5000 spectrometer was used to register the LIBS spectra in a broad wavelength range, while the previously described setup was used for H isotope determination. The delay time and gate width were set to 1300 ns and the gain of the Mechelle 5000 spectrometer was 200 ns. Exemplary spectra for shots 3 and 40 are shown in figure 5a in the wavelength range 500 to 560 nm. The spectra obtained during shot 3 have mainly W lines, while the spectra obtained during shot 40 mostly have Mo lines. The line intensities of various other W and Mo lines were also recorded and the lines are listed in our previous study [1]. The intensities of H isotope lines were determined by fitting the Ha and Da lines as shown in Figure 5b for the spectra of 3rd laser shot. The LIBS depth profile composed of the average values of strong W and Mo line intensities together with D and H line intensities is shown in Figure 5c.
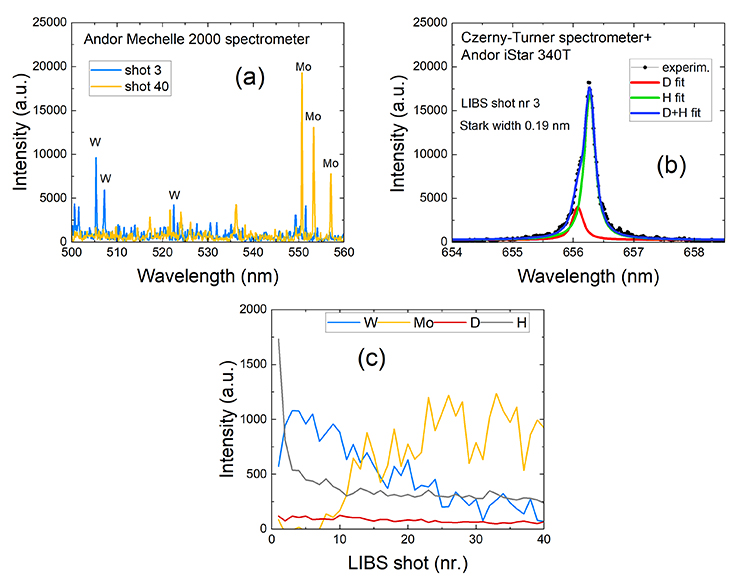
Figure 5. (a) - exemplary spectra obtained in a wide wavelength range by the Andor Mechelle 5000 spectrometer at two different depths of the sample; (b) - exemplary spectra and fitting of hydrogen isotope lines with better resolution by Andor iStar 340 T spectrometer coupled with Czerny-Turner spectrometer; (c) - LIBS depth profiles showing the intensity dependence on the laser shot number for the main elements of the W coating on Mo substrate.
The intensities of W lines increased in the first 1-2 shots, while the H line intensity decreased. Increased H intensity at the surface can be attributed to the effect of moisture. The W line intensities started to slowly decrease at about 8-10 laser shots, while the Mo lines emerged from the noise level. The increase of Mo and reduction of W line intensities was not sharp due to the Gaussian shape of the laser beam, which also resulted in a non-uniform depth of the formed LIBS crater. The number of laser shots when the Mo intensity reached about 50% of its maximum value is about 12-15 shots and this number can be taken as the value required to ablate the W layer. Therefore, the averaged ablation rate was approximately 270-330 nm/laser shot, typical for the investigated coating type. The D intensity was always 3-4 times smaller than the H intensity but clearly detectable.
The paper presents the development and application of Laser-Induced Breakdown Spectroscopy (LIBS) as a robust, in-situ diagnostic technique for analyzing fuel retention in fusion reactor walls, particularly focusing on hydrogen isotopes such as deuterium (D) and tritium (T). The plasma plume behavior varies with background gases (Ar, N₂, He), influencing signal intensity and spatial distribution. Depth profiling of W-coated Mo samples reveals fuel retention patterns in the coatings resembling the deposit layers on first wall and divertor of the tokamaks. Ablation dynamics indicate an average removal rate of 270–330 nm per laser shot, allowing estimation of coating thickness and fuel distribution. The results confirm LIBS as a promising tool for non-invasive, high-resolution fuel retention diagnostics, supporting long-term fusion operations and compliance with nuclear safety standards.
1. Jõgi, P. Paris, E. Bernard, M. Diez, E. Tsitrone, A. Hakola, J. Likonen, T. Vuoriheimo, E. Grigore, Ex-Situ LIBS Analysis of WEST Divertor Wall Tiles after C3 Campaign, J. Nucl. Eng. 2023, 4, 96-110

© Oxford Instruments 2026
