Resources
 Part of the Oxford Instruments Group
Expand
Collapse
Part of the Oxford Instruments Group
Application Notes
Author: Bryan Hennelly, Maynooth University, Ireland
Published: 01 Nov 2025 · Last updated: 19 Nov 2025
Coherent Raman scattering (CRS) techniques, such as Broadband Coherent Anti-Stokes Raman Spectroscopy (BCARS), have become increasingly valuable for label-free chemical analysis of biological samples. BCARS, which is based on the interaction of material with three photons of light provided by intense pulse laser systems, provides access to a broad vibrational spectrum within the biological window, enabling rapid and non-invasive imaging of cells and tissues. Unlike traditional spontaneous Raman spectroscopy, which often requires prolonged acquisition times, BCARS exploits nonlinear interactions between light and matter to enhance signal strength, allowing for millisecond acquisition times. This increased speed opens up possibilities for high-throughput applications in biomedical research.
Recent developments in BCARS have enabled the acquisition of hyperspectral images (HIS) at high spatial resolution and within practical acquisition times, providing a powerful tool for investigating molecular compositions in single cells and tissue samples. The ability to acquire large spectral datasets rapidly allows for detailed chemical profiling without the need for staining or labelling, offering an advantage over fluorescence-based techniques. The unique vibrational features of molecules such as lipids, proteins, and nucleic acids can be identified and mapped to provide rich chemical contrast, making BCARS an ideal technique for cellular analysis.
In this study, we demonstrate the use of BCARS for hyperspectral imaging and for the first time, the classification of immune cells, specifically Jurkat T-cells and CAL-1 plasmacytoid dendritic cells (pDCs). By leveraging BCARS imaging, we achieve accurate, high-speed (5 ms) classification of these immune cells based on their distinct molecular signatures. The ability to classify cells in milliseconds represents a significant advancement for applications like flow cytometry, offering the potential for faster and more efficient high-throughput analysis. Moreover, the results presented here highlight the ability of BCARS to facilitate automated label-free cell classification, a step forward in advancing cellomic techniques for clinical and diagnostic purposes.
The BCARS optical system, shown in Fig. 1, is built around the Olympus BX51 upright microscope, which enables the capture of both brightfield images and coherent Raman spectra using switchable microscope objectives (MO). The white light epi-illumination enables easy imaging, and the BX51 microscope offers excellent stability and flexibility for the complex optical setup that is built around it. A high-quality water immersion objective lens (Olympus 1.2 NA, 60× magnification) is installed in an inverted configuration beneath the imaging MO and physically attached to the original microscope stage this enables the precise alignment of the two focal points. The original microscope stage is replaced with a free- standing ASI XY translation stage with 1um positioning accuracy and 5cm range. Mounted on this is a second more accurate XYZ piezoelectric stage (P-545.xR8S, PI), allowing for nanometirc high speed positioning in XYZ over a range of 200um as well as the capacity to raster scan at speed. The biological sample is mounted on a coverslip and placed on this stage enabling highly controlled sample movement during hyperspectral imaging. Data acquisition is synchronized using a custom MATLAB script, which coordinates the operation of the stages, the laser, spectrograph, and Andor camera, ensuring seamless real-time hyperspectral imaging and analysis.
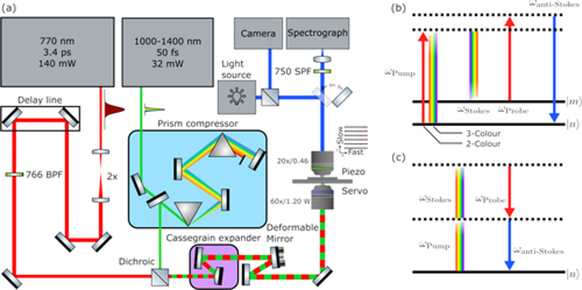
Figure 1 (a) Optical system diagram of the BCARS microscope, (b) Energy level diagram of the resonant four-wave mixing process that models BCARS scattering. Solid lines represent vibrational states of the molecule and dashed lines represent purely virtual states. (c) Energy-level diagram of the nonresonant CARS process. In the energy-level diagrams, the pump photon may originate from the SC laser, indicating the three-color BCARS process, or the narrowband laser, indicating the two-color BCARS process.
At the core of the optical setup is a passively mode-locked laser that produces a seed output at 1550 nm at 1MHz. This wavelength is frequency-doubled using a periodically poled LiNbO₃ crystal to produce a narrowband probe beam at 770 nm with pulse length of ~3.4ps and power of 140 mW. Additionally, the seed laser is coupled into a highly nonlinear fiber, generating a supercontinuum (SC) light source spanning 900–1400 nm with pulse length of ~16fs at 32 mW. The probe and supercontinuum beams are combined using a dichroic mirror and directed towards the sample through the BX51 microscope. The actual lase power on sample is less that the two ratings, and indeed the 770nm must be reduced to avoid burning the sample. Interestingly, the narrow band and broadband pulses play different roles in generating the fingerprint region and the higher band of the BCARS spectrum; this is illustrated in the energy level diagram in Fig. 1 (b). For the fingerprint region, the broadband pulse acts as the pump photon, while for the higher wavenumber band, the narrowband pulse takes on this role.. The narrow and broadband pulses provide the probe and Stokes pulse for both regions. Further information on the physical model are available in Ref [1,2]. The scattered photons from this coherent cannot be recorded directly, and the recorded signal is actually the interference of the coherent Raman scattering with a non resonant background (NRB), illustrated in Fig.1 (c). This NRB is both a blessing because it serves the amplifier that enables high-speed capture, and a curse because it is difficult to retrieve the Raman spectrum from the complex interference pattern.
The scattered light from the sample is collected and directed into an Andor Shamrock 500 spectrograph, which is essential for spectral analysis. The Shamrock 500 uses a 300 L/mm grating, providing high spectral resolution (~10 cm⁻¹), enabling the capture of the full vibrational spectrum from 500 to 4554 cm⁻¹. Two more densely lined gratings are positioned on the shamrock turret enabling higher resolution of specific bands if desired. For detection, the system is equipped with an Andor Newton DU920P Bx-DD thermoelectrically cooled CCD camera. This CCD camera, cooled to -80°C, minimizes thermal noise and provides high quantum efficiency with low readout noise, which is essential for detecting the weak signal as we ramp up the speed of the raster scanning to produce pixel dwell times of 5ms. The camera operates in frame transfer mode, allowing for rapid, precise data acquisition, and is capable of recording hyperspectral with single acquisition times well within the 5ms used in the system.
This integrated system provides rapid, high-resolution BCARS imaging with minimal photodamage to the sample, offering detailed chemical information from single cells with high throughput for cellular analysis.
The workflow for classifying BCARS hyperspectral single-cell data is illustrated in Fig. 2. Initially, HSIs of Jurkat T-cells and CAL-1 pDCs were acquired. The spectra were first wavenumber calibrated to ensure accurate spectral alignment, followed by nonresonant background (NRB) removal using the Kramers-Kronig (KK) method, and denoising with singular value decomposition (SVD) to enhance the signal-to-noise ratio. These preprocessing steps are essential for retrieving reliable Raman-like signals, as detailed in Ref. [2].
After preprocessing, the Cellpose deep learning algorithm segmented the cells, and the spectra for each cell were averaged to create a representative spectrum. A Random Forest (RF) classifier was then trained on the labeled dataset, enabling accurate classification of cell types based on their spectral features. The classifier was also tested on a mixed sample to simulate real-world applications, achieving accurate classification of the mixed cell populations.
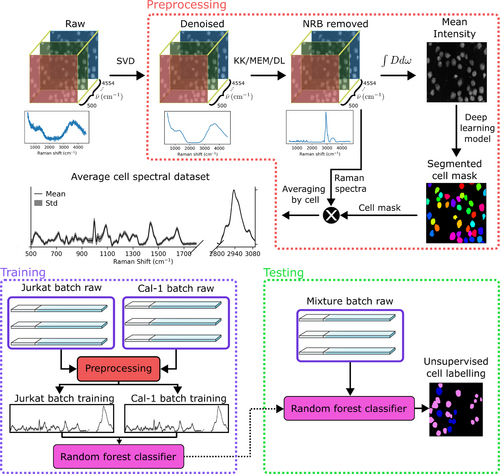
Figure 2: Flowchart of the experimental and data analysis pipeline.
Figure 2 shows representative HSIs of both cell types. The spectra clearly differentiate the two populations in the fingerprint region (500–1700 cm⁻¹) and high-wavenumber region (2800–3000 cm⁻¹), where key vibrational peaks associated with nucleic acids, lipids, and proteins are evident. Figure 2(a) presents a typical hyperspectral image of a Jurkat T-cell with color-coded segmentation masks. The corresponding spectra in Figure 2(b) reveal distinct features for Jurkat T-cells compared to CAL-1 pDCs, demonstrating the ability to map molecular features in a spatially resolved manner for single-cell analysis.
In Figure 3, the mean BCARS image and segmentation mask of the two labelled cell types (Jurkat T-cells and CAL-1 pDCs) are shown, with each color in the mask corresponding to individual cells. Segmentation was accurate even in tightly packed cells, and the average spectra for each cell type matched expected immune cell spectra. The principal component analysis (PCA) showed that the first two PCs explained 55.4% of the variance, with the two cell types moderately separated. The high-wavenumber region primarily contributed to PC1, while the fingerprint region, containing features like CH2 scissoring and nucleic acid modes, contributed to PC2.
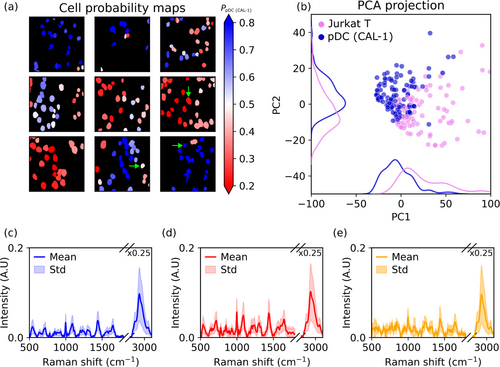
Figure 3: (a) Representative HSI of a Jurkat T-cell with segmentation masks. (b) Corresponding spectra from the segmented regions, showing distinct features for Jurkat T-cells and CAL-1 pDCs. (c) Classification pipeline of the RF model with labeled dataset. (d) Class probability maps for the mixed sample, demonstrating the classifier’s ability to differentiate between cell types.
An example broadband BCARS spectrum from a CAL-1 cell (shown in Fig. 3) closely resembles that of a typical immune cell spectrum, with distinct peaks in both the fingerprint and high-wavenumber regions. The feature importance analysis of the Random Forest (RF) classifier identified key peaks in the fingerprint region, such as thymine and adenine, as most important for classification. The classifier achieved 99.4% accuracy on the test set, with an out-of-bag error of 3%.
Fig. 3 shows the classification results for a mixed sample of Jurkat T-cells and CAL-1 pDCs. The classifier correctly identified each cell’s probability of being one type or the other, though some cells had low classification confidence, potentially due to low signal-to-noise ratio (SNR). The PCA projection in Fig. 3 confirmed that the unlabelled data aligned well with the labelled dataset, suggesting that the classifier generalizes well across different sample types. Scatter plots showed that the cell size distribution was consistent between the labelled and unlabelled data.
Further information on the validation process, including cross-validation, accuracy measures, and detailed evaluation of classification performance, can be found in Ref. [2].
To further advance our examination of BCARS immune cell classification, we shifted focus from averaged cell spectra to single-pixel spectra with the aim of classification using shorter acquisitions. The traditional approach, while robust in validating our hypothesis regarding the effectiveness of using both fingerprint and CH-stretch bands for BCARS classification, relies on aggregating spectra from all pixels within a cell's boundary. This method effectively results in an acquisition time similar to that of Spontaneous Raman, typically around 1 s per cell, thus offering no obvious improvement in cell classification speed. To address this, we explored the potential of classifying cells based on single-pixel spectra taken from the HSI, each with an acquisition time of 5 ms. This approach uses the same segmentation method as described previously, pooling spectra from the two distinct cell lines into respective training and validation sets. An RF model with the same parameters as used in the previous section was applied with a simplified single dataset partitioning for training and validation due to the computational demands associated with 10-fold cross-validation. A 90/10% train/test split was implemented to assess the classifier's performance. The results, as depicted in Fig. 3, were quite promising, achieving a balanced accuracy of 97.1%. This compares favourably with the 99.4% balanced accuracy obtained from the whole-cell data using 10-fold cross-validation, suggesting that rapid classification with single-pixel spectra is possible, albeit with a small reduction in accuracy. Although 10-fold cross-validation was not feasible due to the extensive computational requirements, these findings indicate a significant step forward in speeding up the BCARS classification process.
Looking ahead, the next step involves developing a BCARS-based flow cytometer capable of classifying cell types in flow cytometry applications. By reducing acquisition times to just 5 ms per spectrum, this technology could enable the rapid processing of large volumes of cells, a crucial requirement for high-throughput analysis. The goal is to adapt the BCARS imaging system for flow-based classification, where single-cell spectra are collected from cells passing through a flow chamber, enabling the real-time classification of cell populations. Additionally, future work may incorporate broader hyperspectral scanning techniques for tissue diagnostics, potentially integrating with SRS histology for virtual staining, further advancing the field of automated, label-free cellular analysis.
In terms of improving the current methodology, several points warrant attention. Signal-to-noise ratio (SNR) remains a critical factor in BCARS classification, particularly in the fingerprint region, which often yields lower SNR despite the strong Raman signal. The use of singular value decomposition (SVD) for denoising has proven valuable, but other denoising methods may be necessary for single-cell spectra when high-resolution hyperspectral imaging is not available. Furthermore, the nonresonant background (NRB) removal, although effective using the Kramers-Kronig (KK) method, continues to require manual intervention, and the development of deep learning (DL) models [3] could automate this process, improving the speed and accuracy of the method.
The ultimate aim of this work is to expand BCARS technology into broader, clinical and high-throughput applications, bringing us closer to an effective, automated, label-free cell classification system that can be used for routine analysis in research and clinical settings.

© Oxford Instruments 2026
