Resources
 Part of the Oxford Instruments Group
Expand
Collapse
Part of the Oxford Instruments Group
Application Notes
Author: Lewis M. Antill, Institute of Quantum Biophysics, Sungkyunkwan University, S. Korea
Published: 01 Feb 2025 · Last updated: 12 Feb 2025
Fluorescence microspectroscopy has proven a powerful tool for uncovering the mechanisms behind biological processes in living cells. However, when searching for quantum effects on these biological reactions, the currently available techniques and instrumentation may not provide the sensitivity or specificity required to capture these subtle quantum interactions at low concentrations in complex noisy environments.
Here, we present a custom-built microspectroscope named magneto-fluorescence fluctuation microspectroscopy (MFFMS) for monitoring the quantum behaviour of spin-correlated radical pairs in biological systems1. By utilising the recent advancements in fluorescence detection technologies in the form of single-photon avalanche diodes (SPADs) and an electron-multiplying charge-coupled device (EMCCD, Andor iXon Ultra 888) camera, we were able to monitor small changes in fluorescence signals caused by external magnetic fields. Furthermore, post hoc digital-lock-in amplifier (DLIA) data analysis allowed the removal of non-magnetically sensitive fluorescence from the EMCCD images.
The home-built microspectroscope arrangement (Fig. 1) includes a high numerical aperture objective lens (water or oil immersion, Olympus) in a confocal arrangement. The sample is excited at 450 nm by a continuous-wave (CW) diode laser (Thorlabs) or a supercontinuum source-acousto-optic tuneable filter combination (SC-AOTF, YSL). The fluorescence is spectrally filtered via dichroic mirror (DM, Semrock) and band-pass filter (BP, Semrock) arrangements, before being directed, via a piezo mirror (M2, Newport), onto one or two SPADs (Micro Photon Devices) and/or (with a flip mirror, FM) an EMCCD (Andor iXon Ultra 888) camera. SPADs are arranged to monitor unpolarised or polarised fluorescence, which is easily achieved by switching between a DM and a polarising beam splitter (PBS, Thorlabs), respectively, with no realignment required. For polarised fluorescence experiments, a motorised half-wave plate (λ/2, Thorlabs) is used to rotate the angle of the polarised excitation beam before entering a polarisation-maintaining single-mode optical fibre (PSM, Thorlabs). An external magnetic field (10 mT, 20 ms rise time) is applied via water-cooled Helmholtz coils (home-built) situated around the sample. The magnetic field is monitored with a Teslameter (Lake Shore F71). The sample is housed in a flow channel slide (μ-Slide I0.2 Luer, ibidi) located on a 3D stepper motor/piezo stage (Thorlabs). Sample flow is achieved via a programmable microfluidic syringe pump (Harvard Apparatus). The acquisition software was written in LabVIEW. All data were processed in MATLAB or Python.
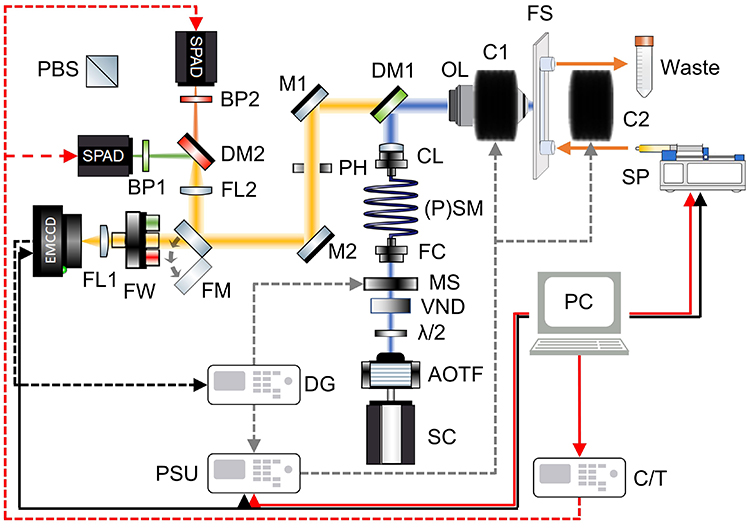
Figure 1: Schematic of the electrical and optical components of the microspectroscope. Details are described in the main text. Abbreviations (in alphabetical order): AOTF is an acousto-optic tuneable filter; BP1 and BP2 are band-pass filters; C1 and C2 are magnetic coils; CL is the collimating lens; C/T is the counter/timer unit; DG is the delay generator; DL is the diode laser; DM1 and DM2 are dichroic mirrors; EMCCD is the electron-multiplying charge-coupled device camera; FC is the fibre coupler; FL1 and FL2 are focusing lenses; FM is a flip mirror; FS is the flow slide; FW is the filter wheel; λ/2 is a half-wave plate; M1 and M2 are mirrors; MS is a motorised shutter; OL is the objective lens; PBS is a polarising beam splitter cube; PC is the personal computer; PH is the pinhole; (P)SM is the (polarisation maintaining) single-mode fibre; PSU is the power supply unit; SC is the supercontinuum source; SP is the syringe pump; SPAD are the single-photon avalanche diode detectors; VND is the variable neutral density filter.
For information on the results of SPAD detection please refer to the publication. Here, we will focus on EMCCD detection and DLIA analysis. Figure 2a shows the trigger regime used. The TTL output of the camera is used as the master trigger to control the Helmholtz coils' power supply and mechanical shutter. Here we demonstrate a CW excitation experiment on HEWL–FMN flowed through the excitation beam. The surf plot shown in Fig. 2b exhibits the MFE for all pixels over time. The fluorescence intensity increases with time at the flow rate of 100 μL min−1 and then reaches an equilibrium level. The opposite is observed for static samples, where the intensity is reduced because of photobleaching. Flavin fluorescence was recorded at a frame rate of 100 ms acquiring 16,800 frames over 28 min, and the magnetic field was modulated at a 50% duty cycle at 0.25 Hz. The inset in Fig. 2b shows the average of every 20 frames, revealing a clear MFE (−0.6%) with an excellent signal-to-noise ratio.
However, this approach hides the response time of the radical pair to the external magnetic field and requires the analysis of every time step (Fig. 2c). Weak fluorescence signals can often be obscured by noisy environments (for example, cells), which can be nigh impossible when measuring 0.1–1% magnetic field-induced changes on the said signal. An approach to extract these magnetosensitive signals is with lock-in detection2,3. Here we demonstrate a post hoc digital lock-in amplifier (DLIA) approach to extract the fluorescence signal at the frequency of the applied magnetic field (on for 2 s, off for 2 s, therefore, 0.25 Hz). The DLIA analysis produces an absolute MFE of −1.37%, which is higher than the calculated MFE of −0.6% in the raw data.
The principal workings behind the DLIA analysis are as follows. Fourier analysis of a complex waveform can be constructed from, or decomposed into, sine (and cosine) waves of various amplitude and phase relationships. A square wave consists of a fundamental sine wave (of the same frequency as the square wave) and odd harmonics of the fundamental. The amplitude of the harmonics is equal to 1/N, where N is the harmonic (1, 3, 5, ...). Each harmonic has the same phase relationship to the fundamental. If we construct a square wave from the first 13 harmonic components obtained from the fast Fourier transform (FFT) of the DLIA detected fluorescence signal, we obtain the square wave shape, after the inverse fast Fourier transform (IFFT), for the magnetic field on–off experiment (Fig. 2c). Single exponential fits to the mean IFFT provide the rise (krise = 4.76 ± 0.98 s−1) and decay (kdecay = 5.08 ± 0.95 s−1) of the magnetic field response time (200 ms) for the HEWL–FMN radical pair. This proof-of-principle approach provides a novel and precise analysis of minute magnetic field-induced changes on weak fluorescence signals.
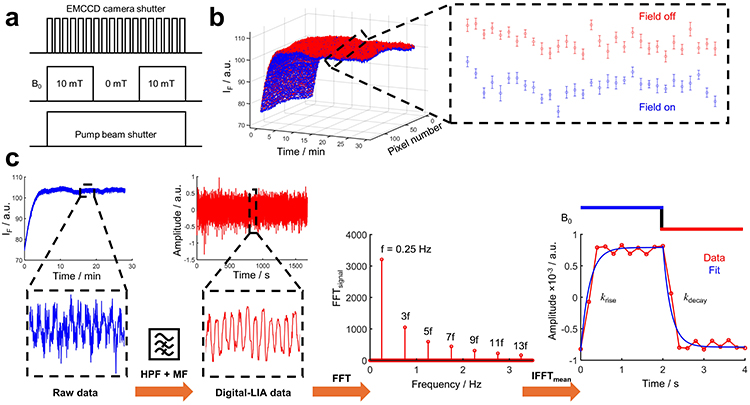
Figure 2: Magnetic field effects (MFEs) and digital lock-in detection with EMCCD detection. a, Schematic of the trigger, where the EMCCD is the master trigger (100 ms) that controls the magnetic coil power supply (2 s on, 2 s off) and the pump beam shutter (CW). b, EMCCD-detected MFE on FMN (2 μM) and HEWL (0.5 mM). Fluorescence was monitored between 500 nm and 600 nm at a flow rate of 100 μL min−1, with 16,800 frames over 30 min. c, Methodology for the analysis of the DLIA. The raw data passes through a high-pass filter (HPF, 0.2 Hz) and 10th order median filter (MF) to obtain the DLIA data. The DLIA data then goes through an FFT and IFFT to acquire the rise (krise = 4.76 ± 0.98 s−1) and decay (kdecay = 5.08 ± 0.95 s−1) of the MFE, which has a 200 ms response time. Data are presented as mean values ± s.d. in b.
In conclusion, the MFFMS technique offers a unique array of capabilities for investigating quantum effects in biology. The instrument allows us to minimise laser power and therefore photodegradation, which will be invaluable in elucidating the true unknown protein–flavin binding dynamics in both in vitro and in vivo experiments. Further DLIA analysis allows MFEs to be observed in fluorescence images, removing spurious fluorescence signals, providing a valuable tool when uncovering magnetosensitive locations within cellular environments. The Andor iXon Ultra 888 camera proves to be a suitable detector for investigating minute magnetic field induced quantum effects on biochemical reactions.

© Oxford Instruments 2026
