Resources
 Part of the Oxford Instruments Group
Expand
Collapse
Part of the Oxford Instruments Group
Application Notes
Author: Selwin Hageraats, Rijksmuseum Amsterdam & Van’t Hoff Institute for Molecular Science, University of Amsterdam.
Published: 10 Dec 2020 · Last updated: 29 Nov 2022
Tags: ms-semiconductors-app, luminescence-app
X-ray excited optical luminescence (XEOL) is a phenomenon in which a material is irradiated with highly energetic X-ray photons and excited electrons follow de-excitation pathways that produce optical photons. The detection of these photons can inform both on the X-ray absorption properties of the material under investigation, as well as the presence of luminescent centers. Up until now, most XEOL studies are performed by recording X-ray absorption and optical emission spectra on samples in bulk, without paying attention to possible spatial heterogeneities.
Here, an experimental set-up is described that makes use of a synchrotron-generated tunable nanofocused X-ray beam (~40 nm in diameter) to induce XEOL in a highly localized manner. Scanning the sample with respect to the X-ray beam and recording XEOL emission spectra for each point then allows to record hyperspectral XEOL images. Making use of the tunability of the X-ray beam, it is also possible to simultaneously record multispectral or hyperspectral X-ray absorption spectroscopy (XAS) images. This combined set-up uniquely provides the ability to perform correlative XAS-XEOL nanoimaging.
The foremost challenge of designing and building a functional XAS-XEOL nanoimaging set-up is having to work with extremely low light levels. Due to the relatively low efficiency of X-ray nanofocusing optics and the low cross-section of the XEOL process, only several hundreds of photons are expected to reach the optical detection system per second, putting very high demands on the spectrometer and detector technology.
The hyperspectral XEOL imaging set-up was built within the scanning transmission X-ray microscope (STXM). The STXM (Research Instruments GmbH) was equipped with a photomultiplier tube (PMT), a 30 nm outer ring width Fresnel zone plate (FZP) lens, and a 50 mm order sorting aperture to focus the monochromatized beam down to a diameter of approximately 40 nm. A silver-coated 15´ 0.3 NA reflective objective (Thorlabs, Inc.) was fixed in the STXM vacuum chamber to collect the optical luminescence from the X-ray focal volume and focus it into a 7´200 mm round-to-linear high-hydroxyl content optical fiber bundle (Thorlabs, Inc.). The optical fiber was coupled into an Andor Kymera 328i spectrograph which was read out using an Andor Newton 970 EMCCD, operated in regular CCD mode, binning 8 pixel columns per spectral channel.
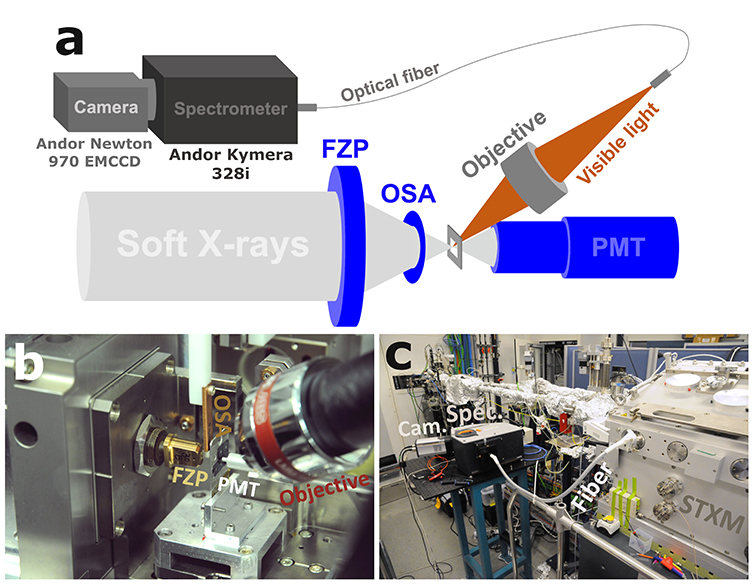
Figure 1: Schematic representation (a) and photographs (b, c) of the XEOL set-up as implemented in the STXM at the HERMES beamline at synchrotron SOLEIL.
Powder samples of the luminescent semiconductor ZnO were drop-casted onto SiN windows so as to obtain dispersed particles with a low degree of stacking. In order to cover some of the wide variety in luminescence behavior, two distinct batches of ZnO were analyzed: a commercially produced zinc white pigment (hereafter denoted ZnO-W) and an ultrapure lab-synthesized ZnO (hereafter denoted ZnO-L). For XEOL analysis, The ZnO dispersions were analyzed with the PMT switched off, the optical detection system switched on, and the upstream beamline slits opened to maximize the X-ray photon flux. Regions of interest measuring between 3x3 and 6x6 mm2 were chosen so as to cover several tens of ZnO crystallites. Defining grids of several hundred spatial points, the integration time of the optical detection system was set between 1 and 5 seconds per spectrum, depending on the luminescence intensity of the ZnO batch. The same regions of interest were then analyzed with the PMT switched on and the optical detection system switched off, yielding multispectral or hyperspectral XAS images at the Zn L-edge (~1030 eV).
Both the XEOL and XAS images were then processed to visualize the contrast between the different ZnO crystallites. False color XEOL images were produced by integrating spectral regions corresponding to UV band gap emission and blue and green trap state emission. The multispectral and hyperspectral XAS images were processed to display the orientation contrast that is related to the X-ray natural linear dichroism (XNLD) properties of ZnO.
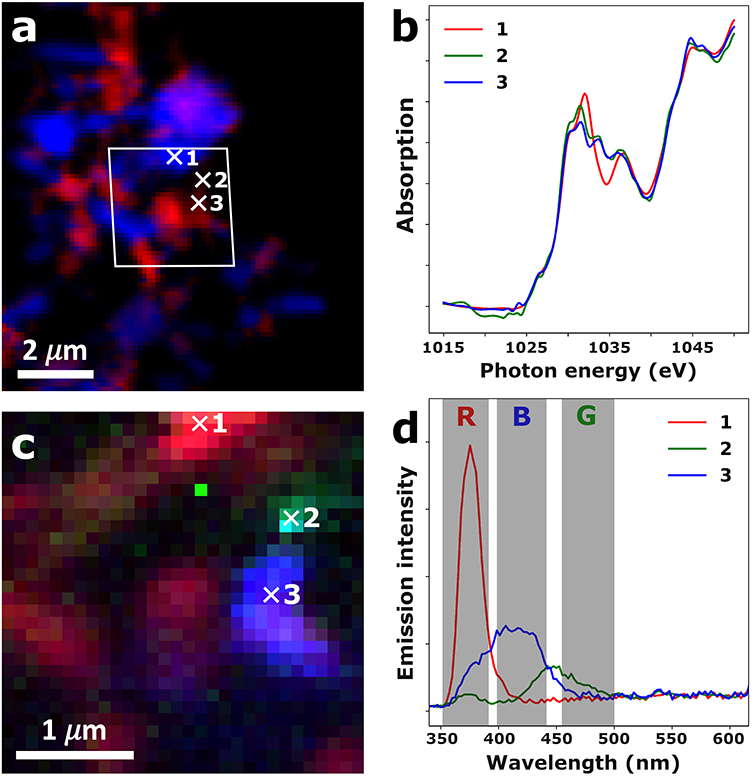
Figure 2: Correlative XAS-XEOL images recorded on a ZnO crystallite agglomerate of the ZnO-L sample. a) False-color STXM image showing XNLD orientation contrast retrieved through SiVM-NNLS analysis. The white parallelogram indicates the region at which XEOL data was recorded. b) Zn L-edge XANES retrieved from the hyperspectral STXM map at the locations indicated by the white crosses. c) False-color XEOL image, obtained by integrating the band gap emission (352-390 nm, red channel), green trap state emission (455-500 nm, green channel), and blue trap state emission (399-442 nm, blue channel). d) XEOL spectral retrieved from the hyperspectral XEOL map at the locations indicated by the white crosses.
The results of the correlative hyperspectral XAS and XEOL analysis on the ZnO-L sample is shown in figure 2. Here, panel (a) shows a false color hyperspectral STXM image of a cluster of ZnO crystallites, exhibiting XNLD orientation contrast. The Zn L-edge XANES corresponding to the three numbered spots are shown in panel (b), clearly showing substantial differences in X-ray absorption behavior at energies diagnostic for XNLD behavior (1031 and 1034 eV). Panel (c) then shows the corresponding false color hyperspectral XEOL image, with the band gap emission shown in red, the blue trap state emission shown in blue, and the green trap state emission shown in green. Finally, panel (d) shows the XEOL spectra corresponding to the three numbered spots, clearly showing the three distinct emission bands and the very significant differences in emission behavior between three different ZnO crystallites.
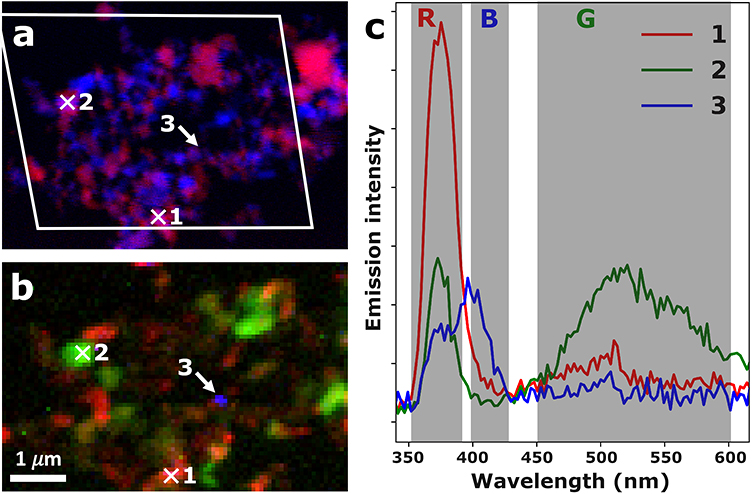
Figure 3: Correlative XAS-XEOL images recorded on a ZnO crystallite agglomerate of the ZnO-W sample. a) False-color STXM image showing XNLD orientation contrast retrieved from the multispectral XAS approach. The white parallelogram indicates the region at which XEOL data was recorded. b) False-color XEOL image, obtained by integrating the band gap emission (352-390 nm, red channel), green trap state emission (451-601 nm, green channel), and blue trap state emission (399-427 nm, blue channel). d) XEOL spectral retrieved from the hyperspectral XEOL map at the locations indicated by the white crosses and the white arrow.
The results of the correlative multispectral XAS and XEOL analysis on the ZnO-W sample is shown in figure 3. Here, panel (a) and (b) show the false color multispectral XAS and hyperspectral XEOL images respectively. The XEOL spectra corresponding to the three marked spots are shown in panel (c). Again, the three ZnO crystallites can be shown to exhibit distinctly different luminescence behavior. Comparing the spectra in figure 2d with those shown in figure 3c, it is also clear that the central wavelength of the trap state emission bands may shift significantly depending on the ZnO production process.
This application note provides a proof of principle of a correlative XAS-XEOL nanoimaging set-up, capable of simultaneously recording hyperspectral XANES and XEOL images. The optical detection system based on an Andor Kymera 328i spectrograph and an Andor Newton 970 EMCCD provides an extremely high sensitivity to UV and visible photons and is capable of recording full XEOL spectra from nanometric volumes within one second. The set-up was demonstrated by studying two different batches of ZnO, showing how XAS and XEOL maps of nanometric spatial resolution can readily be correlated, resolving both the X-ray absorption and optical emission behavior of individual ZnO crystallites.

© Oxford Instruments 2026
