Resources
 Part of the Oxford Instruments Group
Expand
Collapse
Part of the Oxford Instruments Group
Application Notes
Author: Cecile Brun
Published: 01 May 2022 · Last updated: 05 Aug 2025
Tags: In Vivo Imaging, nir-swir-cameras
C-RED 2 is a highly sensitive InGaAs camera which can be cooled down to -40°C for optimal performances, making it a great choice for fluorescence imaging in the NIR-II range. In this note, the performances of the camera to image a new biomarker based on gold nano particles are qualified. The linearity and high sensitivity of the camera enable quantitative fluorescence imaging.
Molecular imaging has become a key player in drug development research. Markers can be used for diagnostic, prognostic, and treatment response monitoring. Biological regions of interest or processes can be highlighted to view otherwise invisible biological responses. For example, IndoCyanine Green (ICG) can generate tumor contrast thanks to nonspecific accumulations [1].
Compared to visible range (400-700 nm) or NIR-I (700-900 nm), NIR-II (1000-1700 nm) fluorescence imaging benefits from lower absorption of the excitation photons, lower scattering and lower tissue autofluorescence. Thus allowing high resolution in-depth imaging with cameras based on InGaAs detectors, such as C-RED 2. For more details on the advantages of NIR-II imaging, you can refer to the note “small animal imaging with C-RED 2”.
In molecular research, contrast, specificity, and retention duration of biomarkers can be engineered and tuned to target specific applications. Numerous approaches exist : single walled carbon nanotubes (SWCNTs) [2], rare earth-doped phosphors [3] , quantum dots [4], polymer nanoparticles, etc.
SWCNT have been established as remarkable fluorophores for probing the nanoscale organization of biological tissues [2].
Recently, a new class of NIR-II fluorophores based on gold nanoclusters (Au NCs) have been developed [5] . One example of these are the commercially available GoldenEyes. They are water-soluble gold nano particles that can be detected noninvasively in vivo in the NIR-II range, and in particular within the NIR-IIa region (1300-1400 nm). Free GoldenEyes are eliminated by the urinary and hepatic routes. This contrast agent enables NIR-II in vivo imaging with lower brightness than ICG but with high photostability and longer blood circulation times.
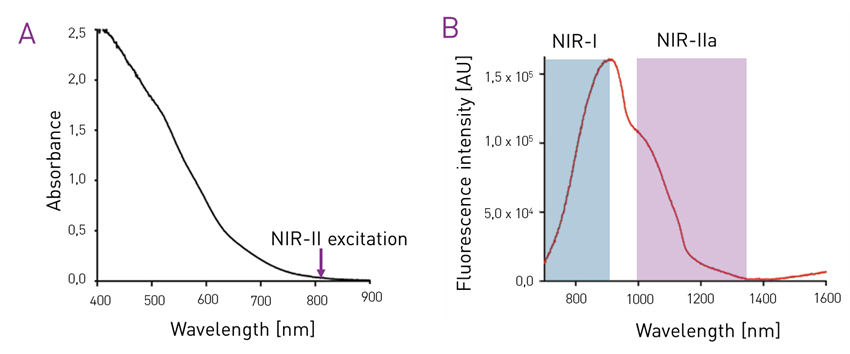
Figure 1 – Absorbance and fluorescence emission charts of the GoldenEyes® fluorophores. Credits Optimal Grenoble.
The characterization of new fluorophores is key to understanding their performances and future applications. The C-RED 2 camera, with its low noise limit, high dynamic range and low linearity deviation is well suited for this application.
The experiment reported hereafter consists in imaging a scale of biomarker drops at different concentrations to:
The C-RED 2 camera is integrated into a SWIR imaging platform. The system was set up by OPTIMAL Grenoble. It consists in a laser source for fluorescence excitation, and an imaging device including an objective, a set of emission filters and a camera to detect the emitted light. The excitation source is an 808 nm laser which provides a 120 mW/cm2 illumination. The emission filter is either a long pass filter with a cutoff frequency at 1064 nm (full SWIR window) or 1300 nm (high SWIR window).

Figure 2 – chematic representation of the imaging system.
A scale of fluorescent drops was prepared from a mother solution of GoldenEyes at 4 mg Au/mL (≈530 μmol/L) in Phosphate Buffer Saline (PBS) 1x. The samples are 10 µL drops: pure then diluted in PBS 1x: 1/2, 1/4, 1/8, 1/16, 1/32, 1/64, 1/128 and so on until loosing the signal when compared to a 10 µL sample of PBS 1x (control). The samples are deposited on a thin plastic sheet.
For each sample, integration time is tuned so that the signal fills roughly 70% of the sensor’s full well capacity. Scales of drops are obtained, such as illustrated below (Figure 3).
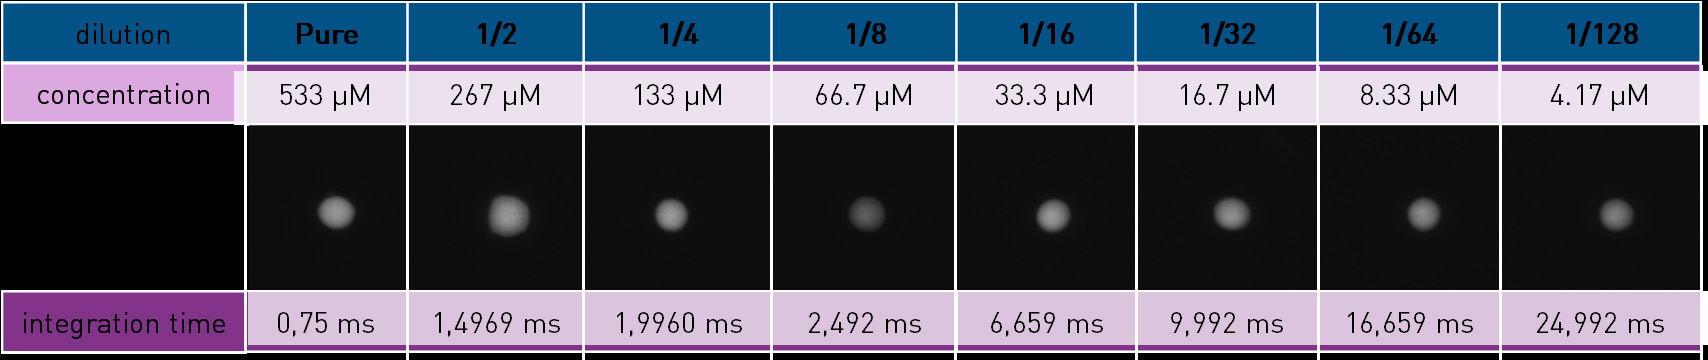
Figure 3 – Scale of drops of GoldenEyes diluted in PBS. The dilution coefficient, integration time and GoldenEyes concentration are noted. The emission filter is a high pass with a cutoff frequency at 1064 nm. The displayed dynamics is [-880 ADU – 16376 ADU]. Images are cropped.
A stack of three frames is acquired for each emission filter, fluorophore concentration and integration time.
In each frame acquired, there are two drops, one of PBS and one of GoldenEyes diluted in PBS (Figure 4). The image processing is done with ImageJ software. Two Regions Of Interest (ROI) with an area of 256 pixels are selected, one on the PBS drop and the other on the GoldenEyes drop. For each ROI the mean signal level is evaluated in Arbitrary Digital Unit (ADU), then divided by the integration time (in ms) to provide a level in ADU/ms.
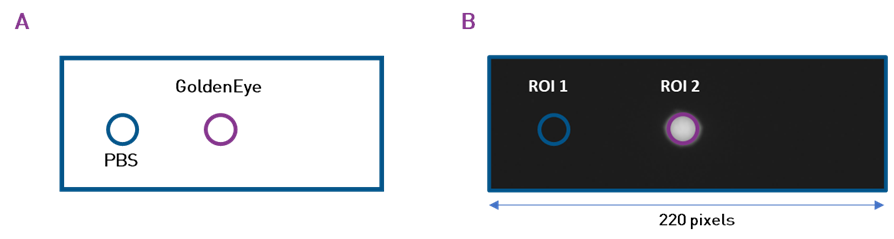
Figure 4 – Sample at one concentration. (A) Schematic representation. (B) Cropped experimental image illustrating the positions of the Regions Of Interest (ROI). ROI 1 is a drop of PBS, ROI 2 is a drop of GoldenEyes diluted in PBS.
To evaluate the linearity of the fluorescence response, the ADU/ms level of both regions of interest (ROI 1 and ROI 2) are plotted as a function of the concentration of GoldenEyes (µmol/L). A linear regression is performed to evaluate the range of concentration within which the camera response is linear (R2 > 0.99).
To evaluate detectability, for each frame the mean level of ROI 2 is divided by the mean level of ROI 1. This provides the Signal-to-Noise Ratio (SNR). The detectability limit is arbitrarily fixed to be SNR = 5.
In the results below, for both linearity and detectability, at each concentration the y-axis value is the average of the values computed for each of the three frames acquired within the same conditions.
Below are the results and analysis for the high pass emission filter with a 1064 nm cutoff frequency.
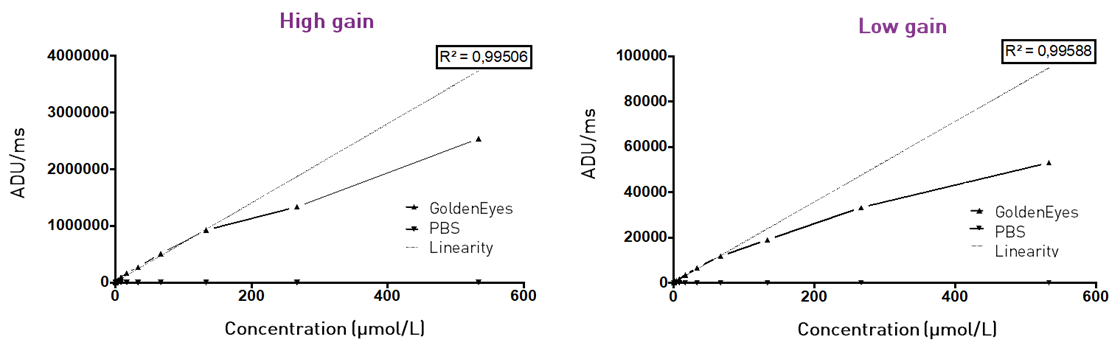
Figure 5 – Linearity graphs: camera response in ADU/ms versus the concentration of GoldenEyes in PBS. A linear regression curve is plotted for the linear part of the response. The linear regression coefficient (R2) is shown.
In high gain mode, the detection of the fluorescence of the GoldenEyes is linear below the concentration of 130 μmol/L (70 μmol/L in low gain). Hence, below this concentration the quantitative detection of GoldenEyes via the measurement of the fluorescence signal can be achieved. At higher concentration, the quantitative evaluation of the signal is compromised by quenching*.
Quenching refers to the weakening of the quantum yield of a fluorophore as a result of the experimental conditions, such as pH, temperature, or fluorophore concentration.
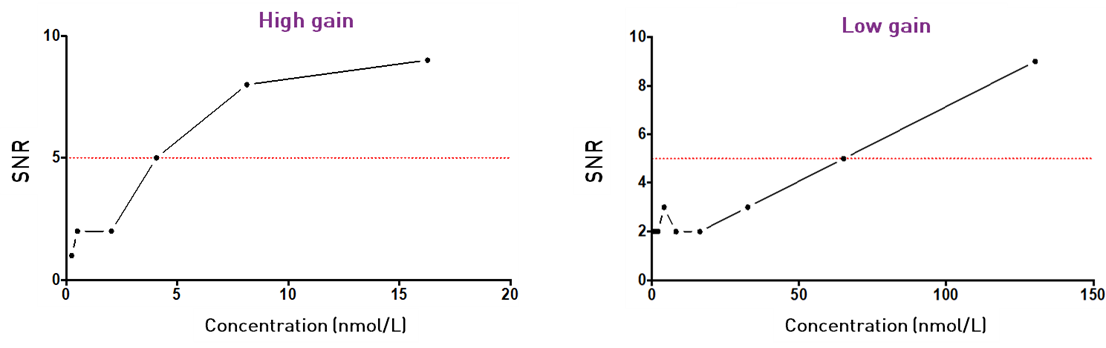
Figure 6 – Detectability graph: Signal-to-Noise Ratio (SNR) versus concentration GoldenEyes in PBS. The SNR is the ratio of the fluorescence intensity of the sample to the camera response to a pure PBS sample. The detectability limit is shown in red (SNR = 5).
In high gain mode, the detection limit (signal to PBS ratio of ~5) is reached at a concentration of 4 nmol/L (65 nmol/L in low gain).
In conclusion, the GoldenEyes present a large linearity range of their fluorescence signal, for both the high and low gains modes of C-RED 2. This opens perspectives to quantitatively measure the fluorescence signal over a large dynamic. The limit of detection of the fluorophore depends on the emission filter and the gain used, and conveniently allows to perform in vivo non invasive imaging of small animals.
The same experiment was performed with ICG: please contact us if you are interested in the results.
The C-RED 2 camera allows to perform precise evaluation of the linearity range and
detectability of new fluorophores in the infrared.
In vivo imaging of small animals is an important phase in the evaluation of new therapeutic strategies. Animal models are often used to reproduce biological patterns of human pathologies. The GoldenEyes are now evaluated in a pre-clinical imaging context.
A six-weeks old female nude mouse (Janvier Labs) was anesthetized and an intracardiac injection of 50 µL at 530µmol/L of GoldenEyes (OPTIMAL Grenoble) was performed. The imaging system is the above described one. The emission filter is a high pass filter with a cutoff frequency of 1300 nm.
A movie of the full mouse was acquired for 6 minutes after injection. Post-injection zoomed images of the abdomen were then acquired. The real-time in vivo imaging experiments were performed by OPTIMAL Grenoble.
Thanks to the low tissue autofluorescence in the NIR-II range, in vivo images with high signal-to-noise ratios and high contrasts can be obtained. The C-RED 2 camera enables on-the fly bias two-point non-uniformity correction (bias and gain) for optimized real-time imaging
The following figure highlights the high contrast and high resolution of the acquired images. The acquisition parameters for Figure 7 are: 2s integration time, 0.5 FPS, Low gain, CDS mode, with hardware long exposure times optimization turned on and on-the-fly bias correction. Optimization for long exposure times enables to obtain high quality images (no hot or cold spots) at very long exposure times and on-the-fly. The contrast was auto-scaled for display but no postprocessing was applied.
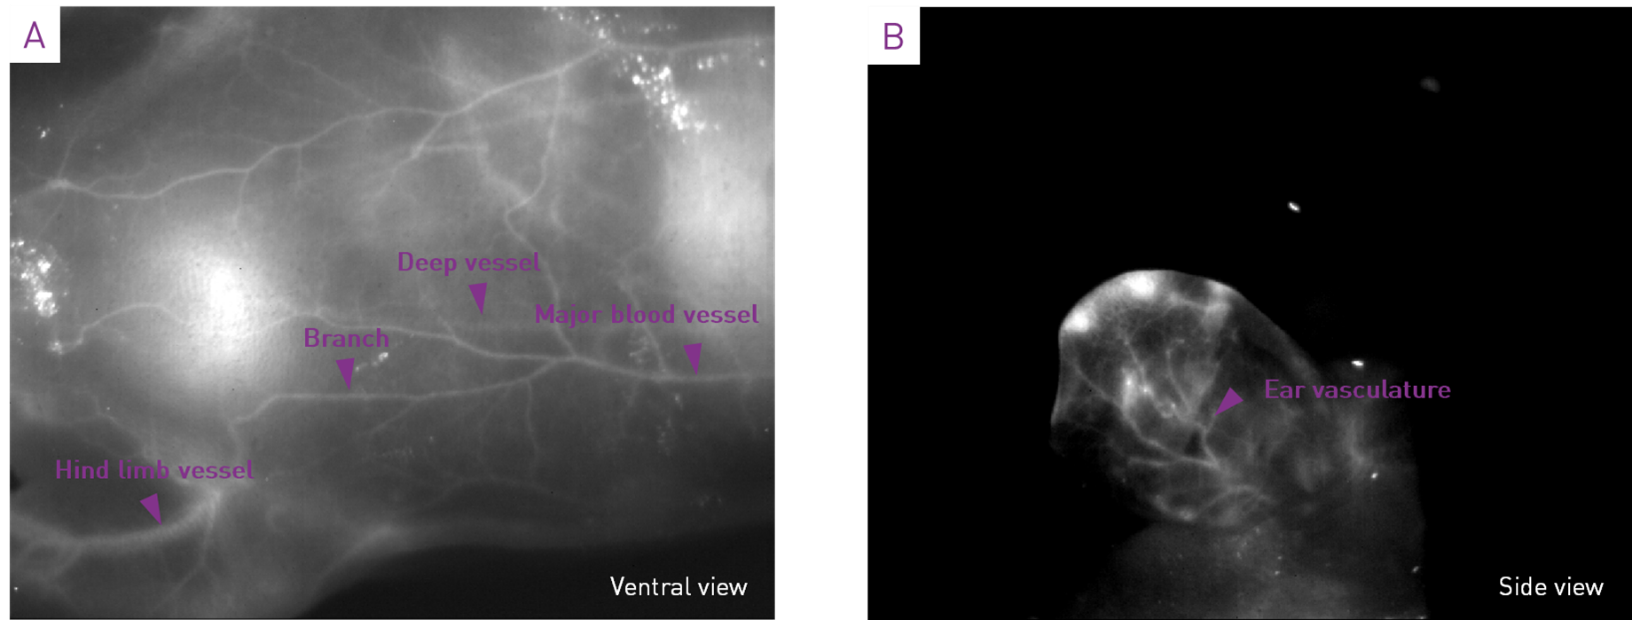
Figure 7 – (A) Image of the mouse abdomen, showing the complex vasculature. Note that deep vessels are detected. (B) Image of the mouse ear showing the diffusion of GoldenEyes in the ear vasculature.
The First Light Vision Graphic User Interface (GUI) enables continuous acquisition of over 8 000 frames (with a standard computer), which can be saved in six different formats including .raw, .tiff, and .avi. The “Direct Record” option allows to save images on-the-fly and acquire even longer movies. Alternatively, a Software Development Kit (SDK) is available to provide guidance in interfacing C-RED 2 with C/C++, MatLab, LabView etc.
Time-lapse acquisitions enable studying the diffusion, time duration and elimination of fluorophores in vivo. This is relevant to study the elimination routes and toxicity of new contrast agents. Figure 8 shows the evolution of GoldenEyes concentration at the hind limb vessel (refer to Figure 7). A time profile of the average value of a region of interest located on the hind limb vessel is plotted. The kinetics of blood circulation can be studied.

Figure 8 – Kinetics of the fluorescence signal at the hind limb vessel. Time is given in seconds post-injection.
For more details on C-RED 2 for in vivo imaging, you can also read our note “small animal imaging with C-RED 2” mentioned above which is focused on IndoCyanine Green imaging in the NIR-II range.
C-RED 2 is well suited for pre-clinical imaging and
enables the acquisition of high resolution and high
contrast images on-the-fly.
Figure 9 – C-RED 2 camera.
Below are a few insights on the key features that make C-RED 2 an ideal choice for fluorescence imaging in the NIR-II range, in particular for biomarker development applications:
C-RED 2 is a plug-and-play high sensitivity camera.
The C-RED range of cameras offers hardware optimization to adjust
to your specific use case.
Thanks to its high sensitivity, linearity, large dynamic range and 14-bits quantization, C-RED 2 is well suited for high-end scientific applications such as research on new contrast agents in the near infra-red.
The two-part experiment with C-RED 2 described in this note illustrates its performances for the development of new fluorophores. A precise evaluation of the linearity range and detectability of the GoldenEyes contrast agent could be performed. Additionally, an in vivo experiment demonstrated the high temporal resolution to precisely map biological dynamics and the high SNR and resolution that could be obtained to study the diffusion of GoldenEyes within a mouse.
C-RED 2 is a state-of-the-art camera designed for high demanding short wave infrared applications. C-RED 2 is versatile and enables high quality sensing at both long exposure times and at extremely fast framerates (up to 600 FPS) and short integration times. Thanks to this, C-RED 2 is very flexible and perfectly suited for small animal imaging.

First Light Imaging acknowledges Optimal Grenoble for assembling the preclinical imaging device and performing the experiments.

© Oxford Instruments 2026
