Resources
 Part of the Oxford Instruments Group
Expand
Collapse
Part of the Oxford Instruments Group
Application Notes
Author: Dr Mark Browne and Dr Alan Mullan
Published: 01 Jan 2021 · Last updated: 11 Sep 2025
Calcium (Ca2+) is an important ion that plays a role in a diverse range of cellular functions. As a small ion it can move freely and rapidly throughout the cytoplasm and cellular compartments. Ca2+ can be used as a rapid indicator of cellular activity from muscle cells (myocytes) to neurons and many others. Work in this field can be traced back to the pioneering work in the 1970s by Roger Tsien and collaborators on the Ca2+ chelating properties of EGTA. In the years since, developments of Calcium Indicators (Ca2+ indicators) are continuing to provide great insights into fundamentals of cell biology, and for example how the cell responds during different disease states, or in response to therapeutic drugs. In this article we will look at the different fluorescent indicators that have been developed to monitor calcium signalling, local calcium levels and studies of their flux or spatial dynamics within cells and compartments.
The most convenient and fastest Ca2+ indicators to use are the single wavelength dyes. These are often used to indicate activity and they tend to be more friendly to confocal imaging because they often match the common excitation and emission wavelengths and light sources.
Of the single wavelength Ca2+ indicators, Fluo-4 is the most widely used. The Fluo-4 organic dye has a peak absorption around 490 nm and emission at around 520 nm, making it almost ideal for 488 excitation and 525 emission - see figure below.
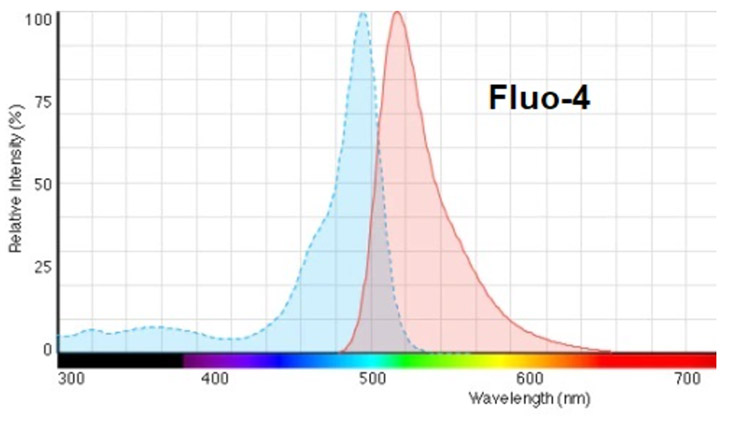
Figure 2: Absorption and emission profile of Fluo-4 Ca2+ indicator dye.
Fluo-4 is relatively bright and stable making it possible to get a strong signal at shorter exposures and with minimal phototoxicity since it also does not require a UV wavelength which may generate more Reactive Oxygen Species. Fluo-4 is a low affinity Ca2+ indicator which means that it allows measurements of high Ca2+ concentrations before saturation, but does not work well for measurements at low Ca2+ concentrations, such as that of the resting cell. In single wavelength measurements it is common to compare the fluorescence emission during activity to that of the resting state using a ratio, F(t)/F(0). Qualitative measurements of Ca2+ concentration can be achieved in this manner, but this presents limitations for quantitative measurements which require normalization of data to account for changes within, and across experiments. Potential issues include uneven dye loading of cells, photobleaching and leakage of the dye from cells during study.
Another group of single wavelength Ca2+ indicators are the Rhod dyes. Although less widely used, they are of note as they shift the excitation and emission towards the longer wavelengths. X-rhod-1 for example, has an excitation at 580 nm and emission at 600 nm. This principle of shifting wavelengths towards the red helps reduce phototoxicity, autofluorescence and effects of light scattering within tissues, so the number of Ca2+ indicators in the red region continues to expand. Another benefit of working in the longer wavelengths is to allow multiplexing with other fluorescent protein tags, or possibly facilitating optogenetic control of membrane potential using channel rhodopsins (Lock et al., 2015).
Ratiometric dyes are useful for quantitative work because they correct for the numerous variations in imaging conditions and specimen preparations such as variation in dye concentration or photobleaching effects. This allows for calibration and normalization of data between different experiments. Ratiometric Ca2+ indicators exhibit a shift in their emission or absorption spectra as a function of local Ca2+ concentration. The acetoxymethy (AM) esterized forms of these dyes are preferred as these diffuse across the cell membrane and are cleaved by intracellular esterases making the cell loading procedure much easier and effective.
Of all of the ratiometric Ca2+ indicators, Fura-2 is most well-known. Fura-2 exhibits differential absorption at 340 nm and 380 nm as a function of Ca2+ (see figure below). The detection of this variation is revealed through the relative intensity of emission at around 510 nm.
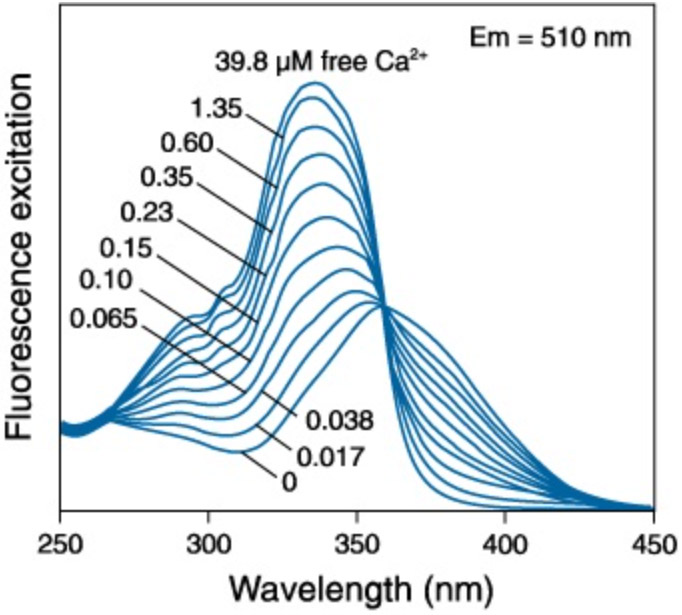
Figure 3: The excitation of Fura-2 Ca2+ indicator dye in varying concentrations of free Ca2+. Adapted from Molecular Probes Handbook of Fluorescent Probes and Research Chemicals
The imaging protocol for Fura-2 is therefore more complicated than for the single wavelength Ca2+ indicators and it requires light sources that provide illumination at 340 and 380 nm. Fura-2 imaging requires sequential illumination with 340 nm and 380 nm with detection at 510 nm, followed by a calculation of a pixel-wise ratio of the pair of emission images. The image can be further analysed by calibration against free-ion concentration. Fura-2 has a high affinity for Ca2+ making it well suited for precise quantitative measurements in Ca2+ at low levels but not for very high concentrations (typically above 1 μM). However, there are a number of Fura-2 dyes developed with lower affinity allowing for measurements at higher Ca2+ concentrations.
Another well-known ratiometric dye is Indo-1, but in this case the dye changes its emission efficiency around two peaks at 405 nm and 485 nm. Indo-1 is excited at around 340 nm and can be sequentially imaged with filters centered at the 405 nm and 485 nm emission peaks.
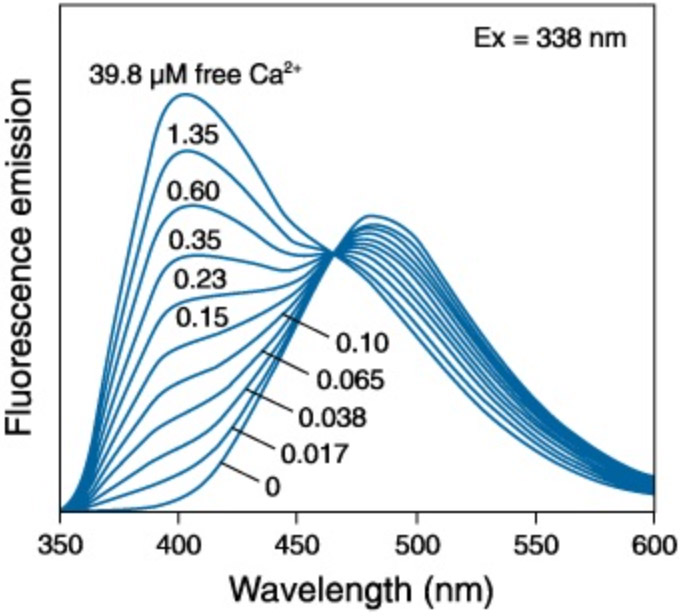
Figure 4: The excitation of Indo-1 Ca2+ indicator dye in varying concentrations of free Ca2+. Adapted from Molecular Probes Handbook of Fluorescent Probes and Research Chemicals
As with Fura-2, the images are pixel-wise ratioed and can be calibrated against free- Ca2+ concentration. One potential issue with Indo-1 is that it can be relatively photo-instable under some experimental conditions. It is often used in flow cytometry measurements in which this is not an issue.
Another class of Ca2+ indicators are the genetically encoded calcium indicators (GECI). GECI Ca2+ indicators such as GCaMP (Nakai et al. 2001) have been derived from green fluorescent protein (GFP) variants. GECIs allow calcium studies to be performed in vivo and are now widely used in transgenic animal models. By using GECIs it is possible to study complex neuronal networks at the single cell level as well as study wider spatial relationships within specific cell types within tissues that would not otherwise be possible using electrophysiological measurements.
The Cameleon GECI relies on FRET signalling to monitor local Ca2+ concentration by changing the emission balance between donor and acceptor on binding Ca2+. Cameleons fuse two fluorescent proteins directly with calmodulin and M13 peptide to produce this sensors pair. On binding Ca2+, the conformation changes and increases FRET coupling between these proteins, shifting the emission wavelength ratio.
The GCaMP-X provides a family of these GECIs for calcium monitoring applications - https://www.janelia.org/open-science/gcamp. Ongoing development of a wide range of GCaMP derivatives has made them better suited to studies that now include coloured GECIs that open the way to multiplexed Ca2+ imaging experiments, permitting better understanding of some of the complex questions faced in neuroscience and beyond.
| Ca2 + indicators | Type | λex,max (nm) | λem,max (nm) | Kd (nM) |
| Fluo-4 | Single Wavelength | 490 | 520 | 345 |
| X-rhod-1 | Single Wavelength | 580 | 600 | 700 |
| Fura-2 | Ratiometric | 340/380 | 510 | 145 |
| Indo-1 | Ratiometric | 340 | 405/485 | 230 |
| GCaMP | GECI | 480 | 510 | 235 |
Table 1: Examples of common Ca2+ indicators shown- note that various derivatives are available including higher and lower affinity forms to suit different experiments. Kd values are those in buffer- values ultimately will depend on the temperature, ionic strength, pH and other factors that vary with each experiment.
The specificity of the Ca2+ indicator to calcium is a consideration as other divalent cations such as magnesium or zinc could potentially interfere with measurement. How tightly and how quickly Ca2+ indicators bind to Ca2+ ions are also important aspects to calcium imaging studies. The binding affinity is defined as the concentration of Ca2+ at which half the Ca2+ indicator molecules are bound with Ca2+ at equilibrium and is expressed as a molar value (nano to millimoles), so that low values indicate high affinity. Indicators should be selected to measure Ca2+ concentrations between 0.1 and 10 times their Kd (Paredes et al., 2008). This range is selected to avoid significant alteration of bound and free Ca2+ in the cell. In general, high affinity Ca2+ indicators can be used to study the lower levels of Ca2+ found in the cytosol while low affinity Ca2+ indicators can be used to study the higher concentrations of Ca2+ typically found in subcellular compartments. How quickly a Ca2+ indicator binds and unbinds can also be important for some studies looking at kinetics. This is described by the association constant, Ka. The Ka itself is described by two components: the association rate constants kon divided by the disassociation rate constant koff. Note also that Ka is 1/Kd.
Working at the short wavelengths required for the ratio dyes is challenging optically. In this section we look at some of the key considerations:

Figure 5: CoolLED pE-340fura has been developed from the pE-300 series specifically for Ca2+ imaging (image courtesy of Chris Deeks, CoolLED).
While common light sources are broadly suitable for single wavelength studies, this is often not the case for ratiometric studies. Mercury lamps exhibit a rather peaky intensity profile making them unsuitable for ratiometric imaging. Xenon lamps in comparison have a relatively flat intensity over the visible spectrum, but intensity does fall off towards the UV where the most popular ratiometric dyes are excited. Moreover, arc lamps tend to have short lives, in the order of a few hundred hours and contain hazardous materials for disposal, but with the evolution of LEDs over the last 10-15 years, arc lamps are now effectively obsolete. We can take advantage of LEDs for Ca2+ imaging which deliver high intensity illumination and solid-state reliability, life-time and switching speed.
In particular, CoolLED pE-340fura can meet the illumination requirements of both ratiometric and single wavelength dyes in a single unit:
To make the most accurate determination of cell physiology the lowest illumination intensity and lowest possible concentrations of indicator dyes should be used. This inherently results in low photon emissions meaning a sensitive detector is highly important. There are two dominant camera technologies that are used for Ca2+ imaging experiments – sCMOS and EMCCD. The selection of these, like the Ca2+ indicators will depend on the study itself given the broad range of applications.
In general, sCMOS cameras notably the Andor Zyla sCMOS camera have been the most widely used for Ca2+ imaging experiments. These cameras are well suited for most experiments:
The Zyla sCMOS cameras therefore remain a recommendation for Ca2+ imaging. Read more about Detector solutions for Neurobiology Imaging.
Recently, the new generation of back-illuminated sCMOS cameras have appeared and these now give an alternative to the previous benchmark Zyla sCMOS cameras for Ca2+ imaging. The new Sona back-illuminated series builds on the performance of the Zyla models keeping the important high speeds, high resolution and class leading quantitative accuracy (critical for ratiometric imaging) and add:
Despite the broad suitability of sCMOS and their continued development, EMCCD detector technology continues to remain highly relevant. By leveraging electron multiplication, iXon EMCCD cameras are single photon sensitive and thus operate at photon levels below the detection limit of any current sCMOS based camera. Some examples of light starved Ca2+ imaging experiments that are suited to the higher sensitivity of iXon EMCCD cameras are:
To find out more about EMCCD cameras for Ca2+ imaging see Detector Solutions for Cardiac Ca2+ studies

© Oxford Instruments 2026
