Resources
 Part of the Oxford Instruments Group
Expand
Collapse
Part of the Oxford Instruments Group
Technical Article
Author: Anna Fasoli, PhD, Sebastien Bellow, PhD, Claudia Florindo, PhD, Mark Browne, PhD
Published: 01 Nov 2022 · Last updated: 07 May 2025
This review covers an overview of Super-resolution Microscopy and the concepts behind it. Click on the table below to navigate to the section of interest.
What is Super-resolution Microscopy?
The Concept of Localization Microscopy
Localization Microscopy: A Family of Super-resolution Techniques
Localization Microscopy: Challenges and Solutions
Fluorescence microscopy is a popular and versatile bio-imaging technique. However, it is limited to a resolution of 200-300nm because of the diffraction of light (1, 2). This drastically limits the number of biological questions that can be answered using conventional optical microscopy.
SSRF-Stream is a low-cost super-resolution technique that allows live imaging and does not require special sample preparation. The resolution achieved by SRRF-Stream can be up to 100 nm in the imaging plane (XY). Learn more about SRRF-Stream+.
Expansion Microscopy (ExM) is a cost-effective sample preparation technique that physically increases the size of specimen and effectively improves the resolution (3). Find out more about expansion microscopy.
The super-resolution technique that gives the highest resolution is Single Molecule Localization Microscopy. This article delivers an overview of single molecule Localization microscopy (SMLM).
A clever way to overcome the limitation caused by diffraction is to use 'pointillism strategy', a concept introduced by Rainer Heintzmann in 2005 (4). The idea is to have only one fluorescent emitter (fluorophore) present at a given time for a given pixel. This localisation leads to much higher resolutions. This idea was further developed into what is now known as Single Molecule Localization Microscopy (SMLM).
In SMLM, only a sparse subset of the total fluorophore population is emitting at a given time (blinking). This creates a temporal separation of the fluorescence coming from the crowded particles labeling the structure of interest. Single-molecule fluorescence is acquired over thousands of sequential images which will eventually be combined to deliver a super-resolved image with nanometer resolution (Figure 1).
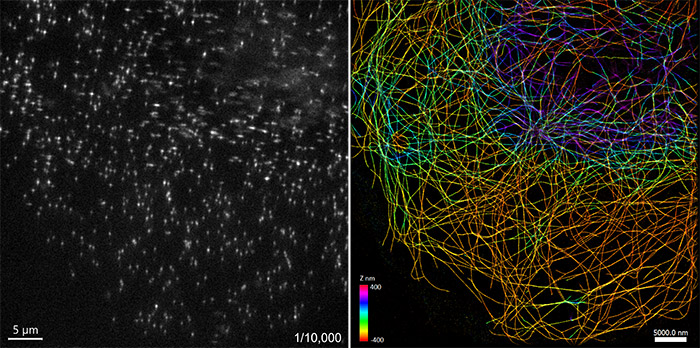
Figure 1. Microtubules in a cell imaged using Single Molecule Localization Microscopy
Left: single image snapshot of a 10,000 time-point series to acquire the stochastic emission of Cy3 fluorophores.. Right: rendering of the data from the left image after drift correction and localization created in Picasso software (5). Median localization precision ~ 13 nm. Image acquired with Andor Dragonfly spinning disk confocal. Data courtesy: Felix Rivera-Molina, Yale University
One of the most important requirements of SMLM is to achieve the blinking of the fluorophores. This necessitatses a fluorescent label that has an on-state (fluorescent) and an off-state (dark). Currently, there are 3 main ways of achieving this: PALM, dSTORM & DNA-PAINT.
In PALM - Photo Activated Localization Microscopy - (6, 7), blinking is achieved by using proteins that can change their fluorescent. These may be photoactivatable fluorescent proteins (e.g.: PA-GFP) or photoswitchable fluorescent proteins (e.g.: Dendra2). These fluorescent proteins are normally in an off- (dark or low fluorescent) state and become fluorescent, and/or change emission wavelength upon illumination with an activation light (usually UV). With this method, the blinking it is easily mediated by just changing the activation and imaging laser power.
dSTORM - direct Stochastic Optical Reconstruction Microscopy (8, 9) uses small organic dyes (such as AF647, Atto488) that in normal light conditions behave the same as all other dyes. The dyes have a ground state, non-fluorescent, and an excited state that is reached if illuminated by their excitation wavelength.
Importantly, these dyes have another state, called the triplet state (or dark state), that allows them to cyclically switch between a fluorescent and non-fluorescent form. This condition is achieved only with very high laser powers and in combination with specialized oxygen-scavenging imaging buffers. In dSTORM, blinking is therefore mediated by the excitation laser power, the buffering, and also any UV light that might help the fluorophores to recover from a dark state to a ground state.
In DNA-PAINT - Point Accumulation In Nanoscale Topography - (5), the sample is labelled with antibodies that instead of having a fluorescent dye, are conjugated with a short, single strand of DNA called docking strand that is not fluorescent. The blinking is then generated by adding a complementary DNA strand with a fluorophore attached, called the imager strand, that randomly binds and unbinds from the target (Figure 2).
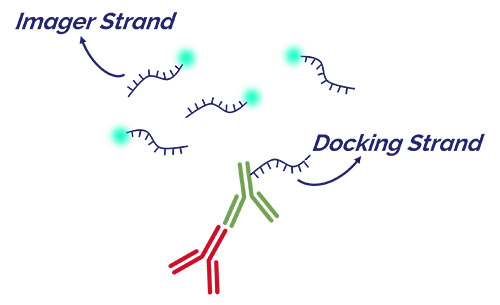
Figure 2. Imager and Docking strands in DNA-PAINT
The docking strand is attached to the antibody that will bind to the structure of interest. The imager strand has a complimentary sequence and has the fluorophore attached to one end. All imager strands are freely diffusing in the preparation being imaged.
Note that in DNA-PAINT there is not effective blinking. The imager strand (which is bound to the fluorophore) is freely diffusing in the sample, generating a homogenous background. When the imager strand pairs with the docking stand (due to DNA-DNA complementarity) it stands still in its position for enough time for the camera to capture what will look like a “blinking event” (Figure 3). The rate of blinking is therefore usually slower than dSTORM because the interaction between docking and imager strands can last up to several hundreds of milliseconds. Importantly, the blinking rate can be easily controlled by choosing the oligonucleotide's sequence and the concentration of the imager strands.
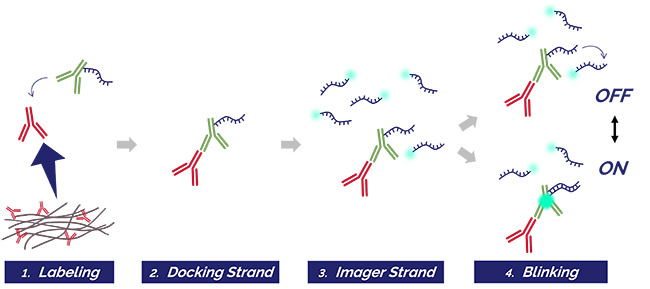 Figure 3. DNA-PAINT protocol
The tissue is labeled with primary and secondary antibodies (1), where the secondary antibody (in green) is conjugated with a short oligonucleotide sequence called the docking strand (2). The complimentary DNA sequence, the called imager strand is paired with a fluorophore of choice and added to the solution (3). 4) When imaging, if the docking and imager strand are not paired, there is no blinking event captured (OFF state). When the imager strand pairs with the docking strand, it will stay bound for a long enough time to be captured by the camera as a blinking event (ON state)
Upon collection of the sequential series of images, all the single fluorescent events must be localized with a processing algorithm. As this is an important step in SMLM, and there are many ways and types of software available to analyze this data, we will dedicate a separate solution note to describe the image analysis in more detail. Briefly, the center of each fluorescent molecule is determined with high accuracy and represented as a sub-pixel set of coordinates. After the localization step is computed for all detected molecules, the final image resolution can be further improved using post-processing algorithms such as filtering and drift correction. It is important to note that, whichever software is used for localization, the highest signal to noise ratio from the images will always deliver the best precision, and therefore higher resolution.
Andor’s software of choice for SMLM image analysis is Picasso (5), it is free, user friendly, and can import and export Imaris files, for a complete workflow from acquisition to analysis.
Movie 1. Endoplasmic reticulum imaged with DNA-PAINT on the new Dragonfly 600
The endoplasmic reticulum was imaged using an astigmatic lens to capture this three-dimensional super-resolution image of 1µm thickness. The localization was computed with Picasso, and the coordinates exported to Imaris and color-coded based on their axial position. Image credit: Dr Florian Schüder, Yale University, USA
The nature of most SMLM techniques makes them not suitable for live-cells. However, it is possible to use PALM in living tissues since it relies on genetically encoded photoactivable proteins (10). Live-cell STORM is also possible with genetically encoded polypeptide tags such as HaloTag or SNAP-Tag combined with adequate fluorophores and suitable buffers, however, the high laser power required to achieve blinking is likely to cause phototoxicity (11).
Z Resolution / 3D Localization
To collect three-dimensional information from an SMLM image, a cylindrical lens is inserted in the light path to create astigmatism (12). This astigmatic lens changes the shape of the PSF (Point Spread Function) into an ellipse, that is distorted vertically when the molecule analyzed is in a lower (negative) Z position, and horizontally when the molecule is in a higher (positive) Z position (Figure 4). The PSF distortion effectively encodes the axial localization with a precision of 30-50 nm.
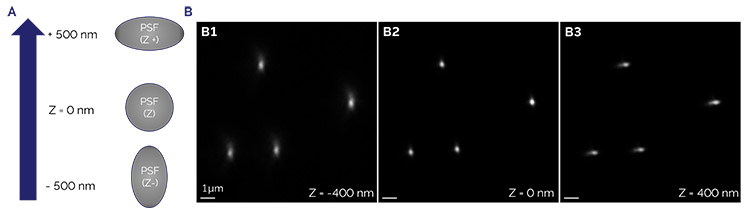 Figure 4. Astigmatic deformation of the PSF for 3D calibration
The PSF calibration is generated from the z-stack of sub-diffraction limited fluorescent beads displaying the axial variation caused by an astigmatic lens. The deformation of the PSF into an ellipse of opposite orientation below and above the focal plane is used to fix the position of blinking fluorophores in Z over an 800nm to 1000 nm range. A) Drawing representation of the PSF distortion; B1) Negative distortion (z = -400 nm); B2) No distortion (z = focal plane); B3) Positive distortion (z = + 400nm).
Contrast Enhancement and Background Rejection
Localization microscopy is generally done using widefield illumination, however, the out-of-focus fluorescence in the background usually degrades the localization precision. To enhance the image contrast and resolution, TIRF (Total internal Reflection Fluorescence Microscopy) is the illumination mode commonly used to reduce background noise without losing signal intensity.
Check out the proprietary TIRF modality of the Dragonfly 600 to see how to achieve excellent results in SMLM - TIRF.
Imaging Depth, Sample Thickness
The limited penetration depth of selective-plan illumination approaches such as TIRF can be addressed by using spinning disk confocal microscopes which combine the advantage of high signal-to-noise ratio and high-speed acquisition.
Ralph Jungmann and his team validated the combination of spinning disk confocal microscopy and DNA-PAINT showing that it is possible to perform localization-based super resolution on a spinning disk. The results reveal whole-cell DNA-PAINT captured with a commercial SDC microscope with sub-20-nm lateral and sub-80-nm axial resolution (13). This opened the door to perform SMLM microscopy beyond the edge of the coverslip.
Andor’s new Dragonfly 600, which has high laser power and new sensitive cameras, is the unique solution that can deliver single molecule localization data from widefield, TIRF or spinning disk confocal microscopy, with localization precisions down to 10 nm in XY plane and 30 nm in Z.
Multicolor SMLM
Multicolor dSTORM is possible but not straightforward: finding two fluorophores displaying good blinking characteristics in the same environment (chemical switching buffer) is challenging. Inducing photo-switching outside of the far-red spectrum requires high laser power illumination (14).
On the other hand, DNA-PAINT enables multiplexed localization based super-resolution by sequentially exchanging the imaging solution containing the imager strand (15). This alternative approach requires extended acquisition time but remains a promising strategy for multicolor super-resolution imaging. Andor Dragonfly allows communication with external devices (e.g.: microfluidics) through easy Python scripts, allowing exciting new multiplex applications such as Exchange-PAINT for super-resolution.
Movie 2. Single molecule localization of the Nuclear Pore Protein Nup96
Using the DNA-PAINT technique on Andor Dragonfly, we were able to visualize the eight radially arranged units that form the Nuclear Pore Complex (NPC). The diameter of the whole NPC rings is about 100-120 nm. The image was reconstructed with Picasso and visualized in Imaris. Image courtesy: Dr Florian Schüder, Yale University.
There are multiple applications for SMLM found in the literature, and the number keeps expanding as these techniques are becoming more available to researchers. The following table is not a comprehensive list of all the possible applications, rather shows examples of already proven experiments in some fields of biology. There will be more applications in the years to come and new discoveries from SMLM will certainly change our current view of how the ultrastructural organization of the molecules within an organism affect and contribute to its overall biology.
| Application Area | Research | Examples |
| Cell Biology | Cell Architecture | 3D STORM images of the actin cytoskeleton in fixed neurons revealed a periodic arrangement of actin network in the axons (16) |
| Organelle Ultrastructure | Mitochondrial fusion and fission & ER remodeling studies greatly benefit from the high resolution provided by SMLM techniques (see 17) | |
| Nucleus | The nuclear pore complex (NPC) is a nanostructure inside the nuclear membrane that mediates communication and selective exchange between the nucleoplasm and the cytoplasm. See it visualized with DNA-PAINT in Movie 1 | |
| Neuroscience | Spine Ultrastructure | dSTORM is used in a 2019 paper from Thomas Blanpied’s lab to precisely measure the post synaptic density and understand neuronal spine plasticity (18) |
| Microbiology | Bacteria Membrane | Ultra-localization of membrane components in E. coli through PALM imaging helps to understand the mechanism of bacterial infection (19) |
| Virology | HIV | Different pattern of organization of the HIV-1 Gag protein on the plasma membrane of the virus have been revealed (21) |
1. Abbe E. (1873). Beiträge zur Theorie des Mikroskops und der mikroskopischen Wahrnehmung. Archiv für mikroskopische Anatomie. 9:413–418
2. Rayleigh L. (1896). On the theory of optical images, with special reference to the microscope. Philos. Mag. 42:167–195
3. Chen, F., Tillberg, P. W. and Boyden, E. S. (2015). Expansion microscopy. Science 347, 543-548
4. Lidke K., et al. (2005). Superresolution by localization of quantum dots using blinking statistics. Opt. Express. 13:7052–7062 10.1364/OPEX.13.007052
5. Schnitzbauer J, et al. (2017). Super-resolution microscopy with DNA-PAINT. Nat Protoc.; 12(6):1198-1228. doi: 10.1038/nprot.2017.024
6. Betzig, E., et al. (2006). Imaging intracellular fluorescent proteins at nanometer resolution. Science 313, 1642–1645
7. Hess, S.T., Girirajan, T.P. & Mason, M.D. (2006). Ultra-high resolution imaging by fluorescence photoactivation localization microscopy. Biophys J 91, 4258–4272
8. Heilemann, M., van de Linde, S. et al. (2008). Subdiffraction-resolution fluorescence imaging with conventional fluorescent probes. Angewandte Chemie Int. Ed. Engl. 47, 6172-6176.
9. Rust, M. J., Bates, M. and Zhuang, X. (2006). Sub-diffraction-limit imaging by stochastic optical reconstruction microscopy (STORM). Nat. Methods 3, 793-796.
10. Shroff, H., Galbraith, C., Galbraith, J. et al. (2008) Live-cell photoactivated localization microscopy of nanoscale adhesion dynamics. Nat Methods 5, 417–423
11. Klein et al., (2011) Live-cell dSTORM withSNAP-tag fusion proteins. Nat Methods 8, 7-9
12. Huang, B., Wang, W., Bates, M. & Zhuang, X. (2008b). Three-dimensional super-resolution imaging by stochastic optical reconstruction microscopy. Science 319, 810–813
13.Schueder, F., et al. (2017). Multiplexed 3D super-resolution imaging of whole cells using spinning disk confocal microscopy and DNA-PAINT. Nat Commun 8, 2090
14. Jimenez, A., Friedl, K. and Leterrier, C. (2019). About samples, giving examples: optimized single molecule localization microscopy. Methods 174, 100-114
15. Jungmann, R., et al. (2014). Multiplexed 3D cellular super-resolution imaging with DNA-PAINT and Exchange-PAINT. Nat. Methods 11, 313-318
16. Xu K, Zhong G, Zhuang X. (2013) Actin, spectrin, and associated proteins form a periodic cytoskeletal structure in axons. Science. Jan 25;339(6118):452-6
17. Shim et al., (2012) Super-resolutionfluorescence imaging of organelles in live cells with photoswitchablemembrane probes. Proc Natl Acad Sci U S A 109, 13978-13983
18. Metzbower S. R., et al. (2019) eNeuro, 6 (3) ENEURO.0419-18
19. Lieberman JA, et al. (2012) Outer membrane targeting, ultrastructure, and single molecule localization of the enteropathogenic Escherichia coli type IV pilus secretin BfpB. J Bacteriol. Apr;194(7):1646-58
20. Lehmann M, et al. (2011) Quantitative multicolor super-resolution microscopy reveals tetherin HIV-1 interaction. PLoS Pathog 7(12): e1002456
21. Malkusch S, Muranyi W, Muller B et al (2013) Single-molecule coordinate-based analysis of the morphology of HIV-1 assembly sites with near-molecular spatial resolution. Histochem Cell Biol 139(1):173–179

© Oxford Instruments 2026
