Resources
 Part of the Oxford Instruments Group
Expand
Collapse
Part of the Oxford Instruments Group
Application Notes
Author: Dr Julian Held
Published: 01 Jan 2021 · Last updated: 24 May 2023
In recent years, high power impulse magnetron sputtering (HiPIMS) has become a viable alternative for the deposition of high-quality hard coatings. Compared to traditional direct current magnetron sputtering (DCMS), where a low continuous voltage is applied, a HiPIMS discharge is driven with short high voltage pulses. This leads to a higher ionization degree and thus better coatings.
One interesting feature of magnetron sputtering discharges is that they feature crossed electric and magnetic fields. This causes a large electron drift above the cathode, which in turn provides the necessary energy to excite waves and instabilities. The most obvious of such wave phenomena can be observed when imaging the discharge with a fast, gated camera. Using gate times in the order of 100 ns, bright spots become visible. The spots rotate in front of the cathode with velocities in the order of 10 km/s. In reference to similar structures found in Hall Thruster plasmas, these bright spots are now often referred to as spokes. Figure 1 shows three spokes in a HiPIMS discharge, operated using aluminum as the target material. The torus shape of the plasma is caused by the magnetic field configuration, which features one magnet behind the center of the cathode and a large ring magnet on the outside. The three brighter spots, however, are spokes. They rotate counterclockwise in the image, in the direction of the ExB drift of electrons (indicated by the white arrow).
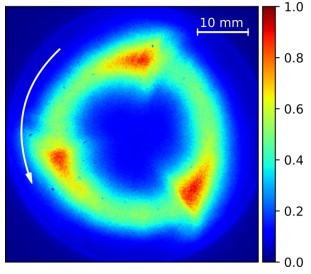
Figure 1- When the cathode of a magnetron discharge is imaged with a fast, gated camera, plasma waves - so-called spokes - become apparent. The image here shows three spokes in a HiPIMS discharge using aluminum as the target material
Investigations of the spoke rotation velocity have provided valuable insight into the physical origin of the phenomenon [1-3]. However, measuring this rotation velocity often requires elaborate measurements involving either probes or photomultipliers. As an alternative, this application note describes the measurement of spoke rotation velocities using the double-image mode of an Andor iStar sCMOS camera (Andor iStar-sCMOS-18U-E4).
To this end, two pictures are taken in fast succession, with a time delay of only 2.2 µs. During this time, the spokes have then performed roughly 1/4 of a complete rotation. Their exact movement is recorded and is used to calculate the spoke rotation velocity under different conditions.
In order to use the double-image mode of the Andor sCMOS camera, an additional external delay generator is required. This delay generator (SRS DG 645) is triggered on the beginning of the plasma pulse (pulse length 100 µs). The delay generator then creates three signals: one at t1 = 94.8 µs after plasma pulse begin, one at t2 = 97.0 µs and at t3 = 95.0 µs. The first two signals are sent into the same BNC cable using a T connector and then brought to the „external trigger“ input of the camera. Thus, t1 and t2 control the gate and define the point in time when each of the two images is taken. The other signal, t3, is sent to the „pre-trigger“ input of the camera and causes the next exposure cycle of the camera to start, ensuring that each time the gate opens in response to the t1 and t2 signal, a different exposure cycle is utilized.
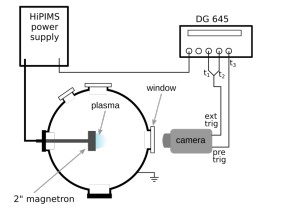
Figure 2: Experimental setup. The magnetron is covered by an aluminum target and operated as the cathode. The delay generator (DG 645) is synchronized to the plasma pulses and in turn, provides the necessary signals to the camera on the „external trigger“ and „pre-trigger“ ports
In this way, two pictures can be taken in short succession. During the 2.2 µs that pass between image 1 and image 2, the spokes will have moved slightly. This movement allows us to calculate the rotation velocity by simply dividing the traveled distance by the 2.2 µs time delay between the images.
Figure 3 shows two pictures, taken with a time delay of 2.2 µs, using the double-image mode of the camera. The three spokes are labeled (1,2,3) to make their movement more apparent. During the time between the two images, the spokes have moved counterclockwise, according to the ExB direction of the discharge, by roughly 1/4 of the plasma circumference. Using this movement and the time delay between the two pictures, we can calculate the spoke rotation velocity. However, to do this in an automated fashion, further processing is necessary.
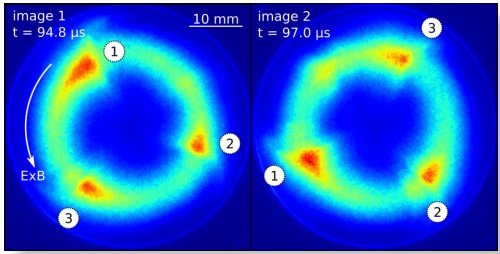
Figure 3: Two consecutive images of the plasma, taken with the double-image feature of the camera with a time delay of 2.2 μs between the images. Three plasma spokes are visible, moving in the ExB direction of the discharge (white arrow).
As a first step, the images are transformed into polar coordinates and slightly cropped. The resulting images can be seen in figure 4. The figure shows the coordi-nate transform of figure 3. Thus, the same three spokes can be observed. White arrows indicate the movement of spoke 1 and spoke 3 towards the left (the ExB direc-tion of the discharge).
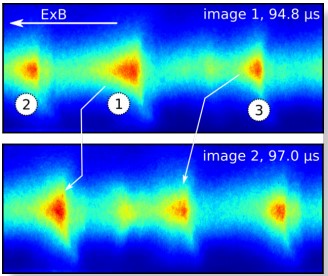
Figure 4: The same as figure 3 but transformed into polar coordinates. Spokes move from right to left in this representation.
As a next step, we now average over the vertical axis of figure 4, to create one-dimensional emission intensity line plots. These line plots are shown in figure 5, still presenting the same data also shown in figures 3 and 4. Here, the shift between the two signals can now be shown in a single graph (figure 5, left)
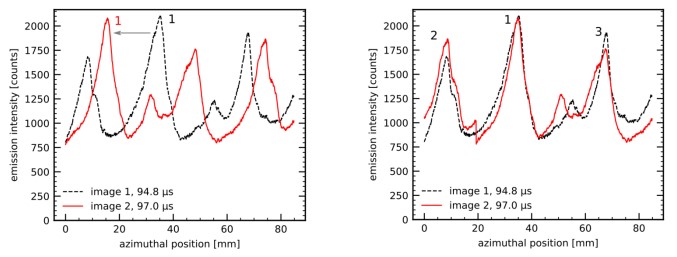
Figure 5: Left: Emission intensity along the azimuthal direction of the plasma, calculated from the data of figures 3 and 4. Right: The emission intensity profile of image 2 is shifted along the axis. The best agreement between both signals defines the optimal shift s, which reveals how far the spoke moved in between the two pictures.
The shift between the two signals can now be quanti-fied by applying a cross-correlation function. From this cross-correlation, the optimal shift can be determined that is necessary to create the best agreement between the two emission intensity profiles. In this example, the shift determined by the cross-correlation function was s = 19.4 mm. From this and from the time delay of Δt = 2.2 μs, we can now determine the spoke velocity to:
vs = s/Δt = 8.8 km/s.
This velocity is perfectly in agreement with what has been previously reported in the literature [3].To check that the determined shift is correct, figure 5 (right) shows a comparison of the original signal from image 1 and the signal of image 2, shifted by s = 19.4 mm. Clearly, good agreement is now found between the two signals, which implies that the correct shift was determined.
The algorithm described above can readily be em-ployed to quickly determine the spoke velocity under different conditions. An example often used in the literature [3] is the variation of discharge power: For a HiPIMS discharge featuring high voltage and discharge current, the spokes are known to rotate in ExB direction with velocities of the order of 10 km/s. In contrast, low-power DCMS discharges feature much slower spokes that move in the opposite direction.
This behavior was measured here for different dis-charge voltages. The plasma was ignited in 0.32 Pa of pure argon, using aluminum as the target material. For each voltage setting, two times 50 images were recorded. From these images, the spoke velocity was determined.
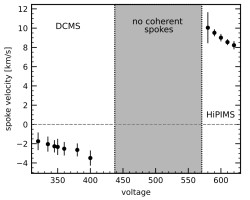
Figure 6: Spoke velocity as a function of applied discharge voltage. For HiPIMS, the spokes move in the ExB direction and the spoke velocity reduces with applied voltage. For lower voltages, the discharge was operated with a continuously applied voltage (DCMS). In this case, spokes move in retrograde ExB direction with much lower velocities.
Figure 6 shows the spoke velocity as a function of applied discharge voltage. The error bars show the standard deviation of the different velocities determined from the 50 double images. For HiPIMS, the spokes move in the ExB direction (positive velocities). With increasing voltage, the spoke velocity reduces from about 10 km/s at 540 V (20 A) to about 8 km/s at 620 V (52 A). For lower voltages, the discharge was operated with a continuously applied voltage (DCMS). In this case, spokes move in retrograde ExB direction with velocities of 2 km/s to 4 km/s.For intermediate voltages, the plasma emission intensity fluctuations are not very pronounced, and no clear movement can be detected. All these results are perfectly in agreement with data reported in the literature [2,3]. However, using the method described in this application report, the measurement is much simpler, requiring only a single camera instead of multiple probes or photomultipliers
[1] Brenning and Lundin 2012 Physics of Plasmas 19, 093505
[2] Hecimovic et al 2016 Plasma Sources Sci. Technol. 25 035001
[3] Held and von Keudell 2020 Plasma Chemistry and Plasma Processing 40:643–660

© Oxford Instruments 2026
