Resources
 Part of the Oxford Instruments Group
Expand
Collapse
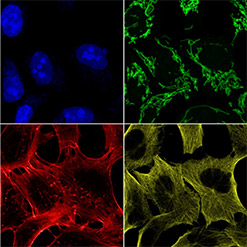
Proper fluorescence channel laser excitation and emission filter activation of the microscope is verified by acquiring a multi-channel image set of a standard specimen having distinctly stained cellular features.
The GATTA-Cells 4C slide is viewed with the 4 confocal channels (Confocal-Blue, Confocal-Green, Confocal-Yellow, and Confocal-Red) using a 60x oil immersion objective lens, and each channel image is checked for the presence of the expected cellular structure (Blue – cell nucleus; Green – mitochondria; Yellow – microtubules; Red – actin filaments). Images are also inspected for any signs of unexpected fluorescence channel bleed through or excitation cross-talk that would result from incorrect laser-filter combinations.
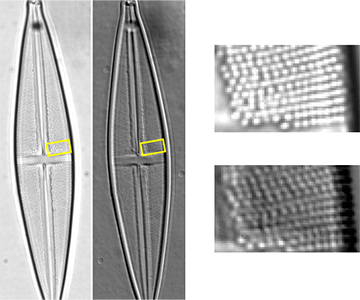
Proper activation and functioning of the microscope’s brightfield and differential phase-contrast (DPC) transmitted light channels can be verified by inspecting the characteristics of a standard specimen that exhibits expected features and structures in these imaging modes.
An image of the mounted Stauroneis phoneicenteron diatom in the Diatom Test Slide V2.0 specimen is acquired with the 60x oil immersion objective lens in the brightfield and DPC channels using standardized transmitted light intensity and detector exposure time settings. Both images are digitally zoomed in the image acquisition software and are visually inspected for the expected areolae forming the striae of the diatom. For proper functioning brightfield and DPC image channels, 12-15 areolae pores should be individually resolvable along a longitudinal striae of the diatom in each acquired image.
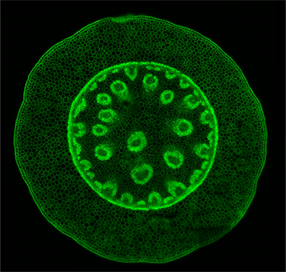
A properly functioning motorized XY-stage of a microscope should be able to accurately acquire a tiled montage of a large specimen across several fields of view without any obvious discontinuity artifacts in the final stitched image.
The autofluorescence of the standard Convallaria (Lily of the valley) woodland plant cross-section specimen is imaged with the Confocal-Green channel using a 60x oil immersion objective lens. The specimen is brought into focus and translated to its center. A tile montage protocol is executed and then the individual fields of view acquired during the protocol are stitched together using the image acquisition software’s automatic image processing routine. The final stitched image is digitally zoomed and visually inspected. This final image should not show any obvious discontinuity artifacts, thus indicating a properly functioning XY-stage.
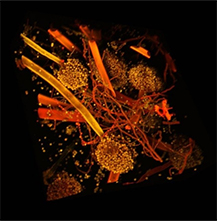
A properly functioning Z-stage of a microscope can be verified by acquiring a Z-scan of a suitable fluorescent specimen exhibiting 3D structure with expected characteristics.
The autofluorescence of the standard Aspergillus brown mold fungal specimen is imaged with the Confocal-Yellow and Confocal-Red channels using a 60x oil immersion objective lens and standardized image acquisition channel settings. A Z-scan protocol is executed within the image acquisition software, and then the imaged 3D volume of the sample is rendered in real-time. The rendered volume is digitally zoomed and visually inspected for presence the expected cylindrical conidiophore stalks that terminate in a single spherical conidia vesicle (mitotic spore).
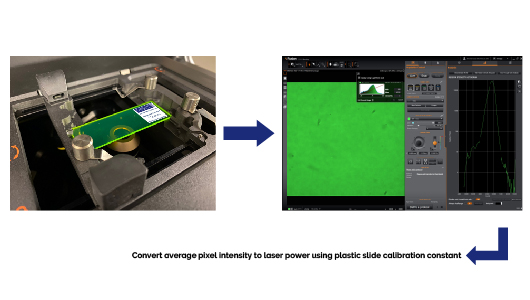
Accurate image intensity measurements to infer relative fluorescent probe concentrations across samples requires consistent and stable laser power levels over extended periods of time and repeated uses of the microscope. Significant deviations from the expected laser power output by the instrument may result from mis-aligned or contaminated optics, a failing laser or associated electronics. Regular measurements of the microscope system laser power are therefore important to ensure that the laser power throughput is steady and that fluorescent intensities are reliable.
Following a 1-hour warm-up period, the full output laser power (100% in software) reaching the objective lens back aperture for each widefield epifluorescence channel (EPI-Blue, EPI-Green, EPI-Yellow, EPI-Red) is indirectly inferred by measuring the intensity of calibrated fluorescent plastic slides using the 2x objective lens and standardized image acquisition settings. The average pixel intensity over the entire field of view is obtained for each channel and subsequently converted into an absolute laser power, P, (expressed in units of milliwatts) using the plastic slide’s unique calibration constant.
The test is a pass if the inferred laser powers are equal to or greater than the specified minimum laser powers entering the back aperture of the objective lens using these epifluorescence channels.
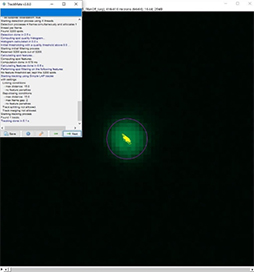
A time-lapse image sequence of a single, immobilized 1-micrometer diameter fluorescent microsphere is acquired in the widefield green epifluorescence (EPI-Green) channel of the microscope at the maximum frame rate of the camera detector while the confocal pinhole disk, illumination homogenizer, and all instrument cooling fans actively spin. The image sequence is then imported into ImageJ and the lateral XY position coordinates of the microsphere in each frame are determined with sub-pixel localization precision using the Trackmate plugin. The standard deviations in microsphere position along the X- and Y-directions are extracted from the time sequence data and expressed as a combined radial standard deviation σxy
To pass the System Vibration test, the radial standard deviation magnitude must be less than or equal to the specified maximum threshold of image motion. If the System Vibration test fails, the Andor Field Service Engineer (FSE) will work with the customer to isolate and remove any external sources of vibration.
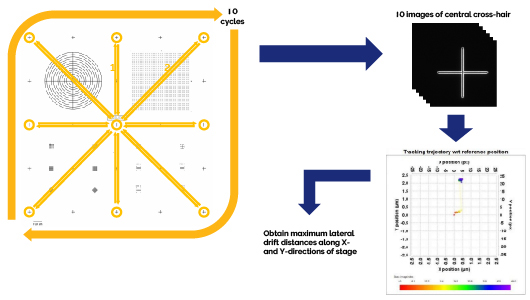
Accurate montage (stitched) and multi-field imaging of a microscopic specimen which are free of stage motion artifacts requires that the XY-stage be able to sufficiently position itself after travelling long distances repeatedly. Sources of stage repositioning errors include environmental conditions (such as temperature fluctuations and airflow) or XY-stage motor malfunctions.
Starting with the central cross-hair of the Argo-HM slide in focus with a 60x oil immersion objective lens using the Confocal-Blue channel, the XY-stage is moved to the other 8 extreme cross-hairs of the slide in succession (top, top-right, right, bottom-right, bottom, bottom-left, left, top left), returning to the central cross-hair after visiting each of these extreme cross-hairs and before moving to the next cross-hair in the sequence through the application of an automated image acquisition protocol. An image of the central-cross hair is acquired after each full round-trip cycle of extreme cross-hair XY-stage travel movements using the same XY stage positioning coordinates in software. 10 such cycles are conducted. The 10 images of the central cross hair are imported into Argolight’s Daybook software and analyzed using the Stage Repositioning Repeatability analysis routine to measure (in micrometers) the maximum lateral drifts magnitudes along the X- and Y-directions with respect to the first central cross-hair image reference position (Max |Driftxy|).
The measured maximum lateral drift distances along both axes must be equal to or below the specified maximum lateral drift distances to pass the Stage Accuracy and Repeatability Precision Test.
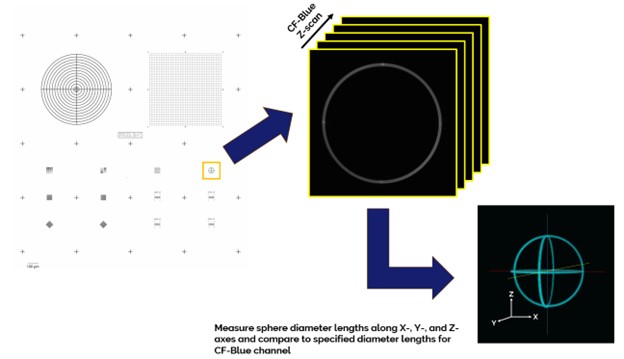
A realistic and accurate representation of a microscopic specimen’s 3-dimenstional shape requires the microscope objective lens focus drive be capable of finely spaced and precise mechanical steps along the Z-dimension.
A malfunctioning focus drive which cannot trace the correct Z-step amount or do so repeatedly results in elongated or compressed sample features in the Z-dimension, which leads to incorrect distance, volume, or cross-channel object spatial and morphological relationships within/between the images.
The microscope’s focus drive performance is measured by first collecting a Z-scan of the Argo-HM slide’s sphere of meridians pattern (Pattern G) with a 60x oil immersion objective lens in the Confocal-Blue channel using a standardized Z-step size and subsequently analyzing the ratios of the measured to specified pattern meridian lengths, G, along the X-, Y-, and Z-axes using Argolight’s Daybook software Accuracy of 3D Reconstruction test.
The measured ratios along each axis must be within the specified ratio range to pass the 3D Reconstruction test.
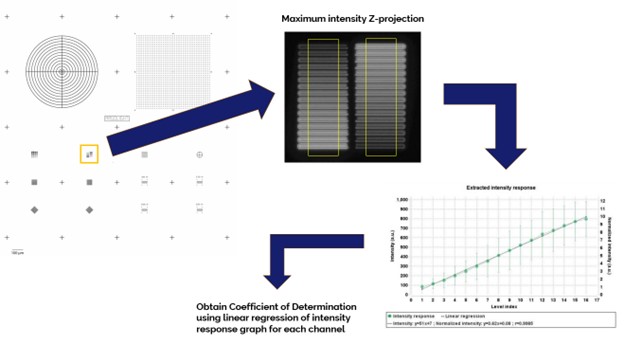
The intensity response of a fluorescence microscope expresses the detector’s output digital signal to an input photon flux. Ideally, the intensity response is linear, thus permitting accurate monitoring of real fluorescence signals present in the sample both spatially and temporally.
Any changes in the intensity response over time could be indicative of a degrading detector sensitivity, inaccurate calibration, or possibly an imminently failing detector.
The imaging system’s intensity response is measured using the 2 x 16 intensity gradation pattern (Pattern D) of the Argo-HM calibration slide. A confocal Z-scan of the pattern is obtained with a 60x oil immersion objective lens using the Confocal-Green channel and then analyzed with Argolight’s Daybook software Intensity Response test. The Coefficient of Determination, R2int, is computed via linear regression.
The measured Coefficient of Determination must be equal to or greater than the specified value for the Intensity Response test to be considered a pass.
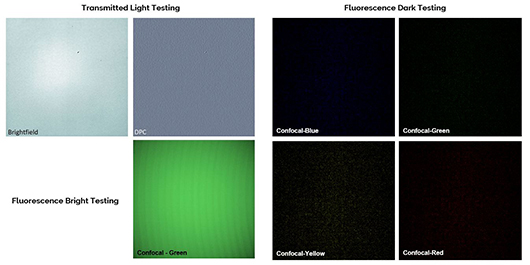
Dust and other particulate matter can settle and accumulate on the optical surfaces of a microscope. Depending on the image mode used, these contaminants can appear as bright or dark spots, lines, or other various patterns in the background of an image which superimpose on the actual sample image, hindering accurate image quantification of various imaging parameters such as local intensity and creating visual distractions that detract and divert attention from the interesting features of the image.
The appearance of such bright/dark background stationary artifacts over time which do not move whenever the XY-stage or Z-focus drive are activated can be indicative of a contaminated or damaged optic that should be cleaned or replaced, but it is necessary to first distinguish these background features from the natural scratches and digs of various optics that were detected and documented at the time of instrument manufacture. For example, a new bright vertical arc appearing over the dark background of a confocal fluorescence image indicates that a small fluorescent particle has landed on the spinning pinhole disk, whereas a significantly dark arc appearing over the bright background of a brightfield transmitted light image is most likely due to a non-fluorescent particle blocking a single pinhole of the spinning pinhole disk. A diffuse “haze” observed in the background of a confocal fluorescence image could be due to autofluorescence or a fluorescent contaminant on one of the instrument optics.
To assess instrument contamination and background artifacts, different image modes of the instrument (Brightfield, DPC, widefield and confocal fluorescence – all channels) are activated in the absence of any sample using standardized image acquisition settings, which is referred to bright or dark background testing. The size, shape, and location of any bright or dark features present in these empty fields of view are documented and then compared to corresponding images obtained using identical imaging conditions at the time of manufacture. Any new features measuring above a certain size and absent in the original factory images are confirmed to be contaminants or damage to an optical surface that must be addressed depending on a pre-determined background artifact intensity modulation depth threshold compared to the empty background signal level.
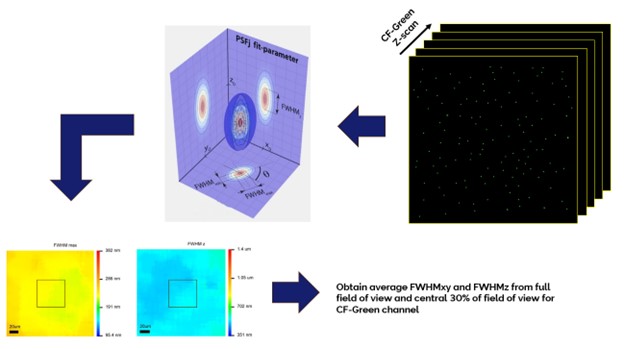
The image resolution of a fluorescence microscope determines how precise the 3D size of small specimen features can be measured as well as the size of the minimum volume within which small features can be confidently distinguished from one another. Overall, the resolution of an imaging system also quantifies the sharpness quality of the image and depends not only on the wavelengths associated with the imaging channel, but also where within the field of view any analysis is restricted to. Resolution is determined via the system point-spread function (PSF) in the X, Y, and Z dimensions by inferring the degree to which the emission light from a fluorescent point-like object, such as a small fluorescent microsphere, spreads out and becomes blurred in the final image of that object.
Deviations from the ideal XY and Z resolution of the system could be indicative of misaligned, contaminated, or damaged optics, or possibly the inherent optical aberrations unique to the objective lens itself.
A Z-stack of a at least one-hundred 200 nm diameter sized green fluorescent microspheres mounted on a 170 um glass coverslip and evenly distributed throughout the full detector field of view is collected in the Confocal-Green channel of the instrument (488 nm excitation; 529 nm emission) using a 60x oil immersion objective lens and standardized image channel acquisition settings. This dataset is then imported into PSFj1 and analyzed using standardized intensity and sub-stack size software parameters to retrieve the average long axis full-width half-maximum (FWHMxy) and average axial full-width half-maximum (FWHMz) fitted microsphere ellipsoid model profile values across the entire field of view and within the central 30% of the field of view of the camera detector.
200 nm sized microspheres are used in this test because of their higher signal intensities compared to sub-diffraction sized microspheres. PSFj accounts for the test object size through the mathematical operation of deconvolution and produces the size-independent resolution parameters.
If the measured lateral and axial FWHM values are equal to or less than the specified FWHM values, then the PSF test is considered a pass. Faklaris et al.2 defined the ratio metrics FWHMxy / resox/y and FWHMz / resoz with an empirical tolerance value of a ratio of 1.5 (over 100 objectives tested).
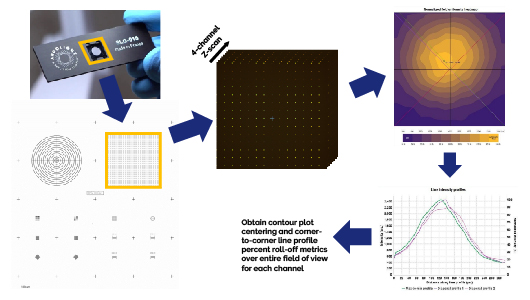
Accurate intensity measurements across the entire field of view, as well as the proper thresholding and isolation of image features or cellular sub-components for subsequent image analysis, require that the microscope’s illumination profile and light detection profile (collectively known as the system uniformity profile) be as centered and even as possible throughout the image. Sources of non-uniformity include mis-aligned illumination or detection optics and also lateral chromatic aberrations inherent to the objective lens itself which cause fluorescent emission light to pass off-centered and/or defocused through the corresponding excitation pinhole of the confocal disk. This latter effect is most pronounced the further one observes away from the center of the field of view.
A full field of view 4-channel (Confocal-Blue, Confocal-Green, Confocal-Yellow, and Confocal-Red) Z-scan of the Pattern B (Field of Rings) on the Argo-HM slide is acquired with a 60x oil immersion objective lens. The image data are imported into Argolight’s Daybook and the background-subtracted maximum intensity Z-projection of each channel is analyzed separately using the software’s Field Uniformity test. The mean intensity of each ring in the image is used to produce the uniformity contour plot from which the illumination centering accuracy*, C, and corner-to-corner (top-left to bottom-right and top-right to bottom-left) percent roll-off metrics are obtained. The uniformity values*, U, of each channel are calculated as 100% minus the measured percent roll-off metrics for each corner-to-corner line profile (same C-U metrics as the metrics defined in Faklaris et al.1 and in the ISO 21073:2019 norm: Microscopes — Confocal microscopes — Optical data of fluorescence confocal microscopes for biological imaging).
The measured Confocal-Blue channel centering must be equal to or greater than the stated Confocal-Blue channel centering specification and both corner-to-corner profile uniformity values must be equal to or greater than those specified for each channel. Under these conditions, the System Uniformity and Illumination Centering tests are considered a pass.
NOTE: Measurement of the illumination centering using Argolight’s Daybook software for the other 3 confocal channels (Confocal-Green, Confocal-Yellow, and Confocal-Red) is complicated by the very flat nature of illumination profiles in these channels resulting from Andor’s Borealis™ technology. It is for this reason that the Centering is measured only for the Confocal-Blue channel.

Accurate image intensity measurements to infer relative fluorescent probe concentrations across samples requires consistent and stable laser power levels over extended periods of time and repeated uses of the microscope. Significant deviations from the expected laser power output by the instrument may result from mis-aligned or contaminated optics, a failing laser or associated electronics. Regular measurements of the microscope system laser power are therefore important to ensure that the laser power throughput is steady and that fluorescent intensities are reliable.
Following a 1-hour warm-up period, the full output laser power (100% in software) reaching the objective lens back aperture for each widefield epifluorescence channel (EPI-Blue, EPI-Green, EPI-Yellow, EPI-Red) is indirectly inferred by measuring the intensity of calibrated fluorescent plastic slides using the 2x objective lens and standardized image acquisition settings. The average pixel intensity over the entire field of view is obtained for each channel and subsequently converted into an absolute laser power, P, (expressed in units of milliwatts) using the plastic slide’s unique calibration constant.
The test is a pass if the inferred laser powers are equal to or greater than the specified minimum laser powers entering the back aperture of the objective lens using these epifluorescence channels.
The chromatic co-registration accuracy is the ability of a fluorescence microscope to properly record images of a multi-colored object. An instrument with ideal chromatic co-registration would show perfect overlap of the multi-colored object in three dimensions across all channels. However, imperfections in the system optics (stemming mostly from the objective lens itself) often introduce minute image magnification differences between channels (lateral chromatic aberration - LCA) and color-dependent channel focus discrepancies (axial chromatic aberration - ACA) which cause some degree of mis-registration between the channel images. These chromatic aberrations are usually spatially varying across the field of view as well, with the strongest mis-registry typically found near the image corners.
Knowledge of the co-registration accuracy between channels, both in the lateral and axial directions, is essential when conducting quantitative cross-channel co-localization or intensity ratiometric studies of multi-labeled fluorescent specimens to prevent misrepresentation of the structures under investigation or misinterpretation of the biological relationships between the stained features of the specimen.
For LCA, a 4-channel (Confocal-Blue, Confocal-Green, Confocal-Yellow, Cofocal-Red) Z-scan of the Pattern B (Field of Rings) on the Argo-HM slide is acquired with a 60x oil immersion objective lens. An A-B test was carried out and the Argolight measurement was equivalent to the results of a bead slide processed in PSFj.
For ACA, a 4-channel confocal Z-scan of evenly dispersed 1 um diameter multi-colour fluorescent microspheres is acquired with the same 60x oil immersion objective lens. The image data are then imported into PSFj1 and analyzed (dual-channel analysis mode) using standardized intensity and sub-stack size software parameters to retrieve the axial chromatic heatmap which plots the measured axial distance between every microsphere within the field of view for the same channel pairs used in the LCA analysis. The ACA is recorded as the axial separation distance averaged over the entire heatmap (Avg |rz|) covering the whole field of view and the central 30% of the field of view.
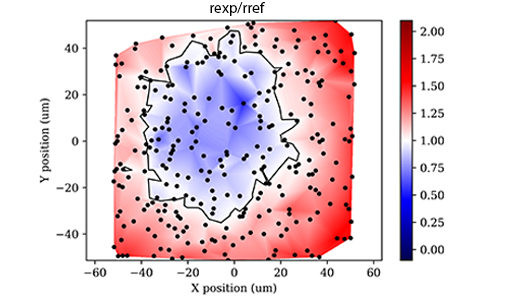
The Chromatic Co-registration test is considered a pass only if the obtained lateral and axial separations distances are equal to or less than the specified maximum lateral and axial separation distances for each channel pair. For reference, the equivalent co-registration ratio metric (rexp/rref) calculated from these specified separation distances is listed as well. (Faklaris et al). The measured ratio, again calculated from the measured separation distances, must also be less than the specified ratio for each listed channel pair (subject to revision from Working Group 4 of the QUAREP-LiMi community3).
The OQ service provides a spatial heatmap of co-registration ratio to enable researchers to identify the zone of reliable co-registration and to design your colocalization experiment for maximum accuracy.