Resources
 Part of the Oxford Instruments Group
Expand
Collapse
Part of the Oxford Instruments Group
Application Notes
Author: F. Feldhaus, I. Schmitz & T. Seeger, Engineering Thermodynamics, University of Siegen, Germany
Published: 01 Apr 2017 · Last updated: 10 Jul 2025
Emissions of internal combustion engines are linked to air pollution, global warming effects and are potentially harmful. In order to reduce emissions like CO, CO2, UHC, NOx and particulate matters (like soot), a better understanding of combustion processes is necessary. Therefore, the combustion temperature is an important factor to know, because it has an impact on the amount of soot and nitrogen oxides. A complete spectral resolved emission spectroscopy based sensor system for temperature determining in Diesel engines is shown. The sensor system is developed for series engines and can be used without any modification of the engine. The soot temperature can be achieved by a contour fit procedure (see e.g. [1, 2]). Temperatures achieved with this sensor system in a sooting laminar premixed flame are proved by coherent anti-Stokes Raman scattering temperature measurements. Application tests on two different production Diesel engines are shown.
The emissions spectroscopy based sensor (ESS) has a modular design. It contains an in-house designed probe head, a customized fabricated optical fiber bundle, a spectrograph (Kymera 193i-A, 200 lines/mm grating) and a back-illuminated CCD detector (Newton DU920P-BU2,1024 x 255 x 26 µm pixels). For the measurements in production Diesel engines, the probe head is applied to the glow plug bore. Only this part of the sensor needs to be customized to a certain engine. The principal setup is shown in Figure 1. The in-cylinder dimensions of the probe head are similar to the glow plug dimensions in order to keep the compression ratio unchanged. By using a small sapphire glass window with a diameter of 2.8 mm the heat losses are insignificant compared to other optical measurement techniques using large optical accesses.
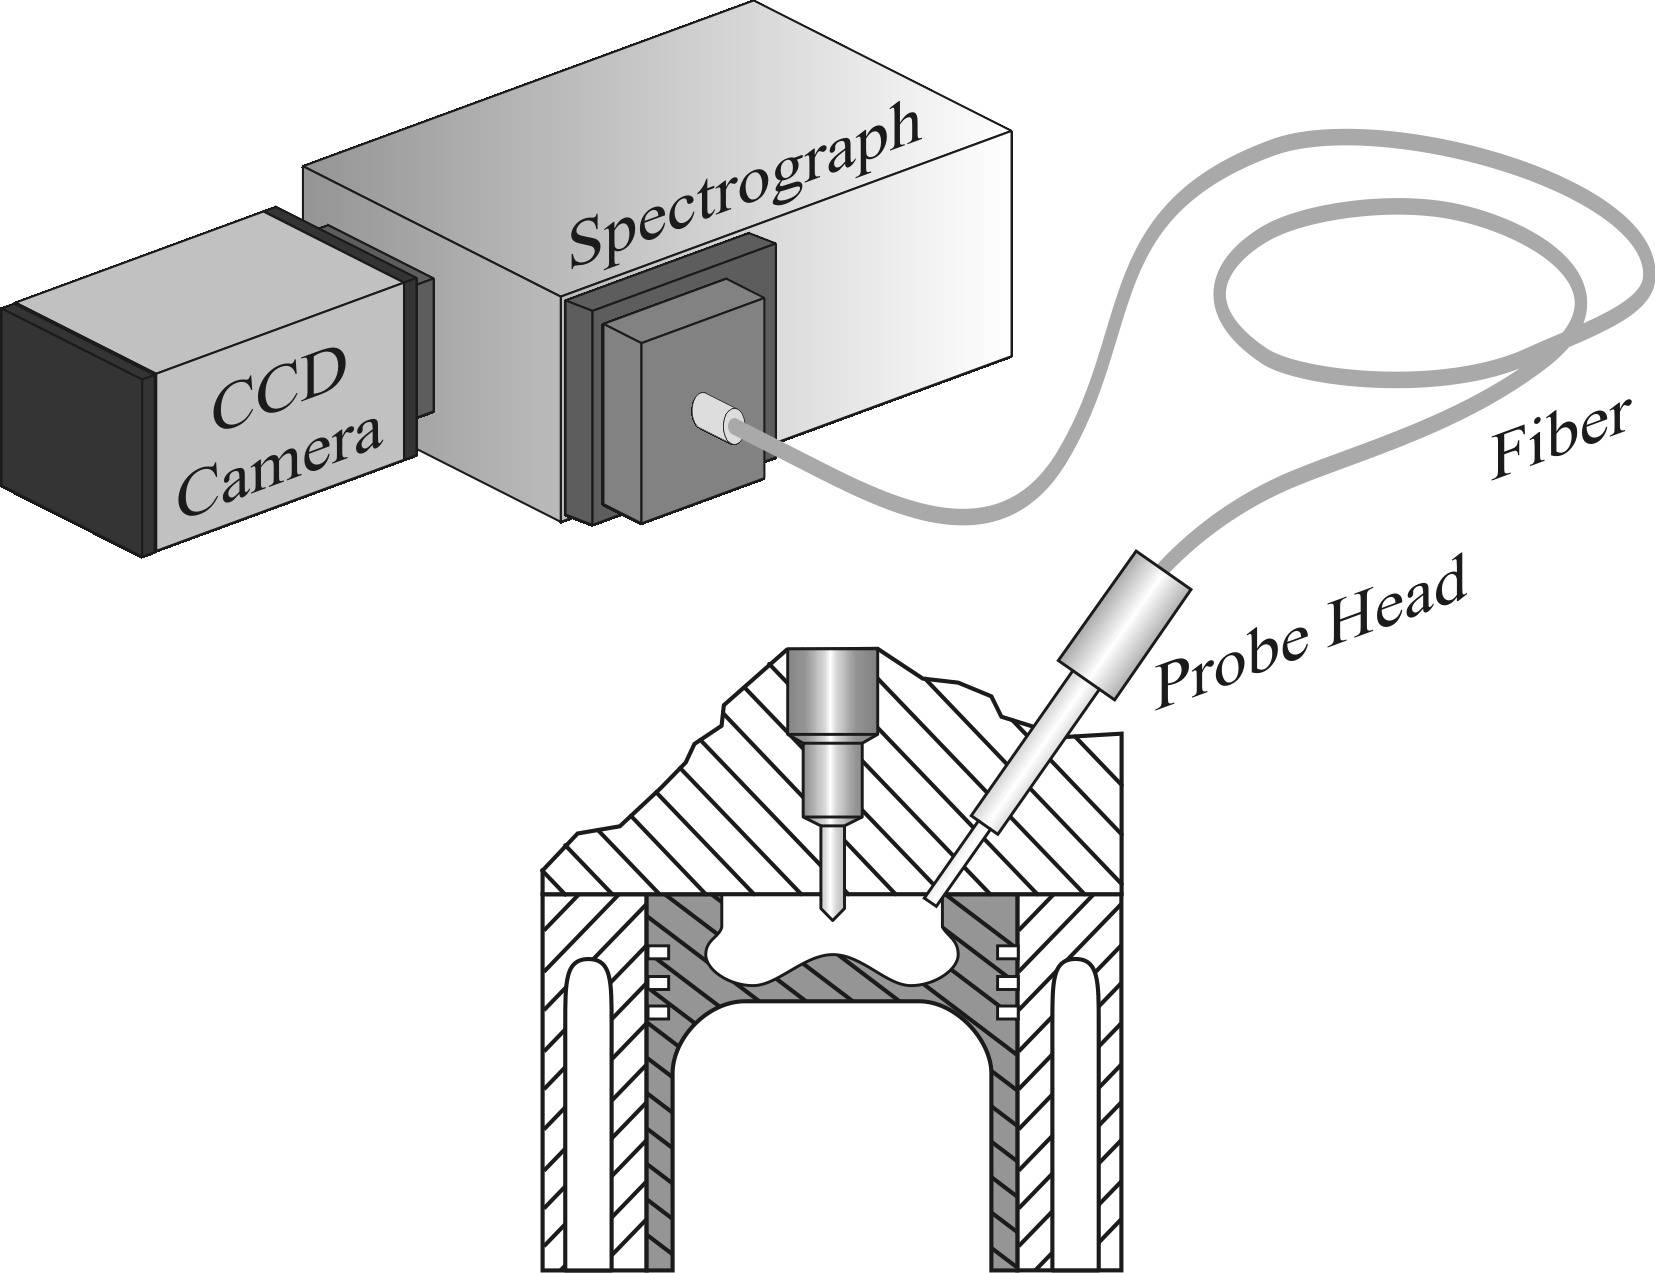
Figure 1: Arrangement of the ESS sensor
The detected flame luminescence is transferred with an optical fiber bundle consisting of 520 single quartz glass fibers, each with 90 µm core diameter, to the spectrometer system. This results in a bandwidth of about 650 nm for a spectral detection range from 200 nm to 850 nm. For additional details see [2]. In a first step the transmission characteristics of the ESS sensor system has to be measured since each optical component has a specific transmissivity. This was done by using an integrating sphere (LOT QuantumDesign, K-150WH) with a known intensity distribution, which delivers the necessary correction function. An example of a normalized ESS raw signal taken in a sooting ethene/air flame and the corresponding corrected signal is shown in Figure 2.
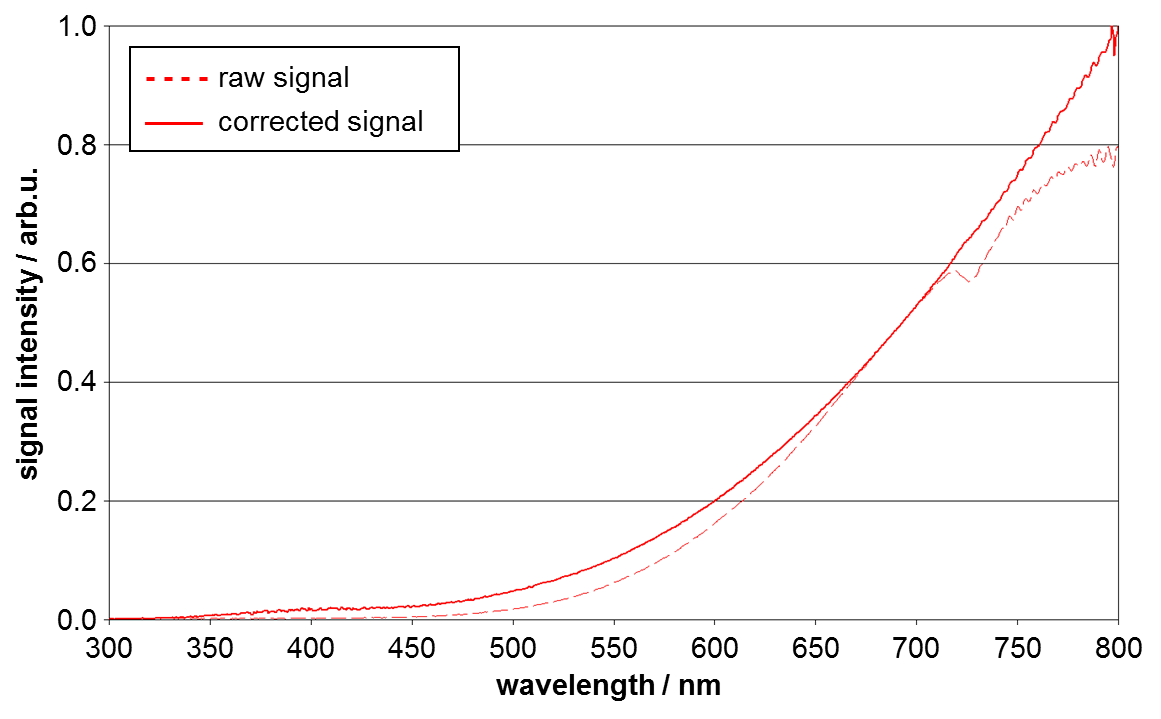
Figure 2: sooting flame emission, detected by ESS
The corrected ESS signal was used to evaluate the combustion temperature by using a modified spectral density equation based on Planck’s law. In general the temperature of a black body can be analyzed by its unique spectral density distribution, which can be described by Planck’s law. In this approach the measured absolute intensities of the soot emission are not relevant since only the shape of the intensity curve was used for a temperature determination. Therefore the signal intensities were normalized to one. An advantage of using these normalized ESS signals is the independence of the primary soot particle size and of the soot volume fraction.
It is well known that soot is not a complete black body and its emissivity depends on the wavelength. Therefore the soot emission can be described by the spectral density distribution based on a modification of Planck’s law. The modification is described in literature [3, 4] and takes the wavelength dependent emissivity into account. Based on this, spectral density distributions calculated for different soot temperatures were used to build up a library [2]. A contour fit procedure compares the measured and corrected spectrally resolved ESS signals with these calculated library spectra in order to achieve the measured soot temperature.
The ESS system was tested and compared to CARS temperature measurements at a laminar premixed ethene/air flame (air-fuel ratio of ϕ = 2.3) established on a McKenna burner. A mean temperature of TCARS,mean = 1709 K was achieved. Simultaneously ESS soot temperature measurements were performed. For the ESS measurements a mean temperature of TESS,mean = 1751 K was determined which is in good agreement with the CARS results. Detailed information about the experimental setup can be found in [2].
As a first test the ESS sensor system was applied to a 80 kW series four cylinder 1.6 l DI Diesel engine (DV6TED4, manufactured by PSA). The new developed ESS sensor was mounted in the glow plug bore of cylinder four. Since the dimensions of the sensor head are identical to the glow plug dimensions the compression ratio (CRPSA = 18.3) is the same as the tested production engine.
This measurements were performed at different engine operation points with a constant engine speed of 2000 rpm. The exposure time of the ESS system is set to 3.69 ms resulting in a time resolution of 45 °crank angle (CA) per spectrum. The soot signals were detected within two time interval. Measurement interval one (MI-1) was between 40 °CA after top dead center (ATDC) and 85 °CA ATDC to monitor the early stage of the combustion process. The second interval (MI-2) was between 85 °CA and 130 °CA ATDC.
The soot temperatures measured by the ESS sensor for MI-1 and MI-2 are 1780 K and 1630 K, respectively. These temperature differences are expected and can be explained by the different measurement times after start of combustion since MI-2 is monitoring a later stage of the combustion process. Supplemental details of the mentioned test and additional test are published in [2] comprehensively.
Further Diesel engine combustion flame temperatures measurements were done in another series engine. During these experiments the ESS sensor system was applied to cylinder one of a series four cylinder Diesel engine with an engine displacement of 1.6 l (engine type EURO 5). In order to leave the compression ratio of CREU5 = 17.3 unchanged, the geometrical shape of the sensor probe head is identical to the glow plug shape.
These tests were conducted at several operation points with an engine speed of 2000 rpm. During these tests the time resolution could be reduced to 5 °CA per spectrum. This was achieved by using a special readout mode of the CCD camera. In this readout mode only the 32 bottom rows of the CCD chip are used for spectra recording. Therefore an exposure time of 10 µs could be realized and each row is shifted into the readout register with a vertical shift rate of 77.52 kHz. To associate the determined temperature to a certain period of the engine cycle, the ESS sensor system was synchronized to a crankshaft-position transmitter. Each ESS measurement consists of 500 single spectra recorded at a predetermined crank angel (one spectrum per engine cycle), from which a mean soot temperature were determined. Figure 3 shows exemplary a resulting temperature probability density function at 2000 rpm and an engine load of 150 Nm, where a mean temperature of TESS,mean = 1502 K was determined. The corresponding standard deviation is 64 K.
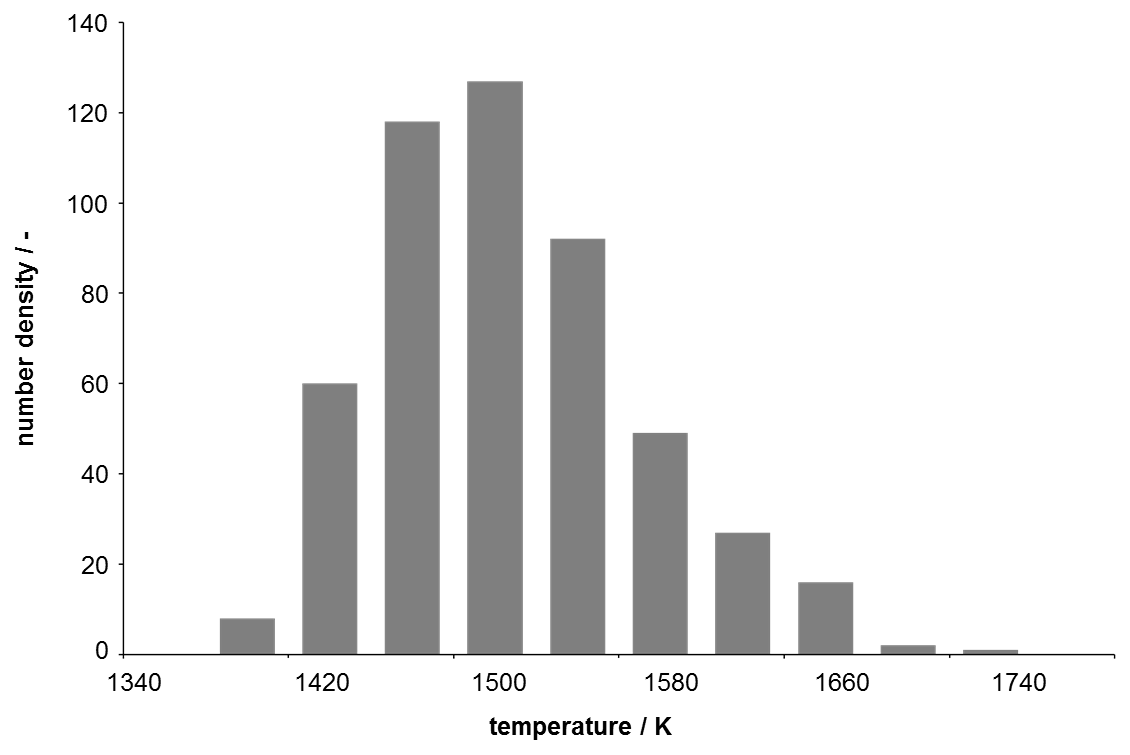
Figure 3: Probability density distributions of ESS temperature evaluation (2000 rpm, 150 Nm, 0 °CA)
The standard deviation is mainly caused by the typical Diesel flame fluctuation, where the diffusion flames arise at various locations of the combustion chamber, whereas the ESS measurements were averaged over time and constant observation volume.
Due to the short measurement times, temperatures were acquired at different common operation points. During this test the engine load of the examined operation points was varied between 10 Nm – 150 Nm as listed in Table 1. In this context the beginning of each ESS sensor system measurement is fixed to 0 °CA (combustion top dead center). The archived temperature results are listed in Table 1.
| No. | Load (Nm) |
TESS, 0 °CA (K) |
| 1 | 10 | 1578 K |
| 2 | 50 | 1572 K |
| 3 | 100 | 1485 K |
| 4 | 150 | 1502 K |
In contrast to an increasing engine load during these tests, the temperature decreases. Nevertheless, this behavior was expected and can be explained by a displacement of the CA position where 50 % heat release is achieved (CA50), which is generated by the engine control unit. A higher load results in a shift of the CA50 to an earlier stage, while the start of the ESS measurements was kept constant at 0 °CA. Therefore the ESS system detects at higher load a later phase of the combustion process, where the flame temperature is accordingly lower.
Concerning the ESS sensor performance it should be noted that the sensor was operating for up to twelve hours without significant particulate deposition.
The development of a complete spectrally resolved emission spectroscopy based sensor is demonstrated. This sensor system allows in-cylinder temperature measurements in production Diesel engines without any engine head or crankcase modification. The developed sensor probe head is replacing the glow plug of a serial Diesel engine and has the same dimension. This sensor system was tested in comparison to a CARS system at a sooting laminar premixed flame.
The potential of this ESS sensor system was successfully demonstrated in first tests at a production four cylinder 1.6 l DI Diesel engine. Further test on a different series engine (1.6 l EURO 5 Diesel engine) confirmed the potential of the emission spectroscopy sensor system. Shorter measurement intervals (5 °CA/spectrum) were realized. Soot temperature measurements were performed at different engine operation points and showed that the ESS sensor system is a valuable tool to characterize the in-cylinder combustion process of production Diesel engines.
Fabian Feldhaus
Engineering Thermodynamics
University of Siegen
Paul-Bonatz-Str. 9-11
57076 Siegen
Germany
Phone: +49 (271) 740-2880
E-mail: fabian.feldhaus@uni-siegen.de
Web: www.mb.uni-siegen.de/tts/

© Oxford Instruments 2026
