Resources
 Part of the Oxford Instruments Group
Expand
Collapse
 Part of the Oxford Instruments Group

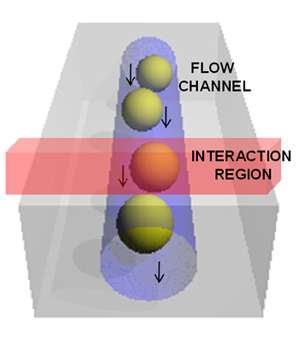
Figure 1: Schematic of the particles in the fluid flow and interaction region of the laser within the flow cell.
A key and continuing goal in the development of flow cytometry techniques is the ability to measure ever more parameters for each particle under test. Work carried out by Prof John Nolan’s group at La Jolla Bioengineering Institute, and reported recently by Watson et al [1] in Cytometry A, outlines the development and operation of a Raman Spectral Flow Cytometer (RSFC), which is perhaps the most radical and challenging approach to current efforts in spectral flow cytometry. In their ‘proof of principle’ system, they bring together Raman spectroscopy, via surface enhanced Raman (SERS),and conventional flow cytometry, by substituting a dispersive-optic spectrograph with multichannel detector (CCD), in place of the traditional mirrors/beam splitters, filters and photomultipliers (PMT) of conventional flow cytometers. They demonstrate a system of sufficient sensitivity to acquire and analyse SERS spectra with good spectral resolution from samples consisting of nanoparticle SERS tags bound to microspheres. The functionality and power of the system is illustrated using two analytical methods, virtual bandpass filtering and principal component analysis (PCA), to distinguish between the different Raman species within their test samples.
A significant motivation for this group′s work is to increase the multiplexing capability of cell and particle-based flow cytometry applications. This requires the ability to access more parallel data channels from the same sample at the same time.
Conventional systems have been developed to offer higher numbers of simultaneously measureable parameters: specially configured systems with up to 19 parameters are available (direct scatter, side scatter and multiple fluorescence channels) but this requires multiple PMTs, filters, several lasers, multiple fluorophore labels and wavelength selective mirrors. The problem that arises with trying to extend such systems to more channels, apart from the expense and the operating challenges, is the inherently broad fluorescence characteristics of the fluorophores. As the number of fluorophore fluorescent bands is increased, the more overlapping of bands takes place and it becomes increasingly difficult to distinguish the individual signal channels. This limits the number of possible data channels.

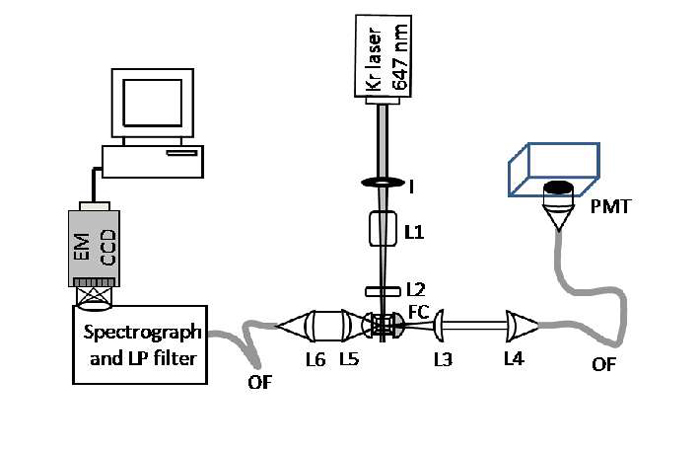
Figure 2: Schematic of RSFC instrument (Courtesy of Prof John Nolan, La Jolla)
Having a dispersive-optic based system provides a simpler setup configuration and the potential for high resolution spectroscopy. The La Jolla group has chosen surface enhanced Raman spectroscopy, with its characteristically information-rich narrow band spectral features, as a route to accessing a higher number of measureable parameters.
Two key technologies are being drawn upon in the development of fresh approaches to flow cytometry. The first, (a), takes advantage of the ability of silver nanoparticles to enhance the Raman scattering intensity of an active species by many orders of magnitude, or as in other work, the use of fluorescent nanocrystals, with their relatively narrow emission bands, as markers of the species of interest. The second, (b), is the development of electron multiplication CCD detectors (EMCCD), with their enhanced sensitivity which is advantageous when fast spectral rates and short exposure times are a requirement.
Other groups working on spectral flow cytometry are focusing on fluorescence signatures [2] to characterise the samples and some of these groups use multianode PMTs or avalanche photodiodes (APD) rather than CCDs for the detector.
Figure 1 illustrates the flow cell and the interaction region where the laser excites the sample particles or cells. A schematic of the RSFC instrument is shown in figure 2. It shows the main components used: the laser and its delivery into the flow cell (FC) with focusing optics (l, L1, L2). The detection of the Rayleigh side scattered signal, collected by lens optics (L3, L4) into an optical fibre (OF) and delivered to a photomultiplier (PMT). The SERS signal collected (L5) and coupled (L6) into an optical fiber which was sent to a spectrograph with long pass filter (LP) to eliminate the Rayleigh scatter at the laser wavelength. An EMCCD camera captured the spectral data. The forward scattered data was detected with a photodiode (not shown) which also acted to deliver triggering for acquisitions by the camera.
Their test samples consisted of glass-encapsulated SERS tags (Ag nanoparticles of ~67nm diameter, with an adsorbed Raman reporter molecule and encapsulated in glass), bound to the surface of polystyrene microspheres (3.3μm diameter with ~8000 nanoparticles per microsphere). Four different Raman reporters were used in the preparations, each giving its own characteristic Raman signature. Each microparticle was tagged with one out of the four Raman reporters.

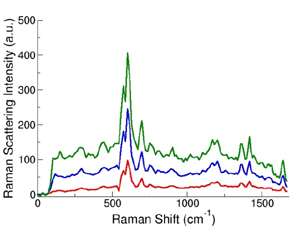
Figure 3: Sample SERS spectra from SERS tag-labelled microparticles. (D. Sebba and J. Nolan,unpublished data)
Data was captured for each particle as it passed through the interaction region (figure 1) in the form of a Raman spectrum, typical examples of which are shown in figure 3. Clearly there is potential for a wealth of information from the sharp and highly resolved spectral features of these spectra compared with the broadband data attainable with the traditional filter systems or indeed spectral techniques using fluorescent markers.
Watson et al. then proceed to demonstrate two powerful methods for analysing their data to discriminate between the four different types of microparticle. The first approach, referred to as ‘virtual bandpass filtering’, is analogous to the real-time filtering bandpass techniques of conventional flow cytometry. It offered the possibility to define ‘optical filters’ to select regions from the SERS spectra to emphasize differences between the four types of particle, leading to the derivation of a new set of parameters for comparison purposes. A particularly nice aspect of this method is the flexibility for optimisation, by both readjustment of the virtual bandpass regions and defining the number of new parameters to be used. However, Watson et al. point out that this approach becomes complex and cumbersome, as the number of SERS tags increases, with their associated density and overlap of spectral features.
The second method they used to distinguish the four SERS tags was that of Principal Component Analysis (PCA). PCA was applied to the first order derivative that was calculated from the smoothed and normalized SERS spectra. The ability to discriminate between different SERS tags, with this advanced and well established analysis technique, was clearly demonstrated.
The use of a spectrograph with spectral deconvolution algorithms has the potential for a more comprehensive and flexible approach to multi-colour or multiparameter analysis. The La Jolla group has developed such a system as a new addition to the tools of flow cytometry, the Raman Spectral Flow Cytometer (RSFC). Challenges remain in terms of speed and sensitivity (whilst maintaining good resolution). Advances in camera acquisition rates and digital processing speeds will enable faster analysis rates – a key requirement of modern flow cytometry. The coming years will see these challenges being addressed. The potential benefits as regards current biological and new applications is immense.
Appreciation is gratefully extended to Prof John Nolan and his group at La Jolla Bioengineering Institute.
