Resources
 Part of the Oxford Instruments Group
Expand
Collapse
 Part of the Oxford Instruments Group
Continuous flow of solvent used widely both for reactors and in analysis, providing control over the interaction of reactions. Mixing of solvent streams is a major challenge especially in the micron dimension channels used in microfluidic systems where the flow is typically laminar. Relying on diffusion alone for mixing between side-by-side flowing solvent streams requires long channel lengths which is inefficient.1 So-called static mixers, patterned structures in the walls of channels, can disturb flow, for example the staggered herringbone groove motif introduced by Stroock et al.2 These structures produce vortexes in the channel, Figure 1, and have seen widespread application due to efficency of mixing achievable across a wide range of flow rates (5-1000 μL min−1 for a 300-μm-wide channel).2,3
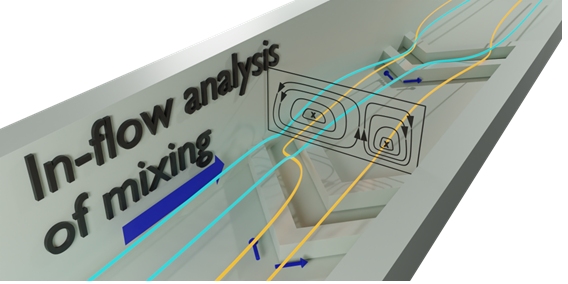
Fig. 1 Microchannel with slanted herringbone grooves. Solvent streams (from left to right) tumble over the grooves generating vortexes in the channel.
The quality of mixing ultimately determines the required length of a (micro)reactor. The flow profile created by such static mixers was first characterized by confocal fluorescence microscopy by adding different fluorescent probes to each of the solvent streams being mixed revealing the profile of the double vortex, Figure 1.2
An alternative approach to characterising mixing is line-focused imaging using Raman spectroscopy. Raman spectroscopy is optically equivalent to fluorescence spectroscopy, but has the advantage of being label-free, with sharper spectral lines, often called a molecular fingerprint, allowing for multiple species to be identified simultaneously. Using line-focused illumination, the Raman scatter can be collected along the entire length of the line to produce a spectral image across the width of the channel.
The process of readout of the image by standard CCD based detectors presents a challenge to the line-focused image approach. Coupled pixels in a CCD transfer collected charges down to the bottom of the chip, where the charges are read out, which can lead to artefacts in images especially along the height of an image. This issue can be overcome by shuttering during readout, at the cost of increased readout times. Alternatively single point detector arrays can be used, where each detector readsout one pixel in the image, avoiding interference by smearing or blooming.4 This approach is similar to the way an sCMOS-type camera reads out images directly from each pixel and hence sCMOS detectors is potentially better suited to spectral imaging than CCD detectors. The higher noise of sCMOS compared to CCD, however, makes its use in Raman imaging less obvious. Nevertheless the potential for sCMOS cameras is demonstrated in imaging the meniscus between two immiscible solvents, Figure 2. Spectra of individual solvents are observed when the line is positioned above or below the meniscus, respectively. When the line illuminates the meniscus, the Raman spectra of each solvent is observed spatially separated.
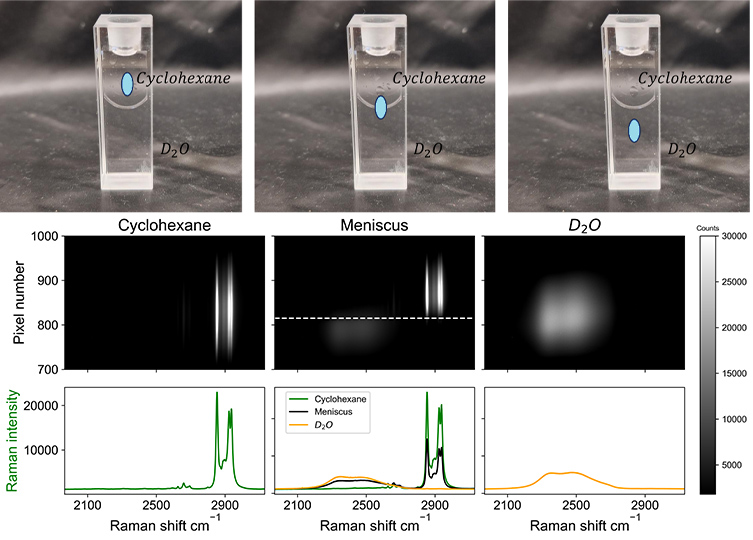
Fig. 2 Raman spectral images recorded at 473 nm using an sCMOS detector. Bands are cyclohexane (left image, 2852 cm−1, 2923 cm−1 and 2938 cm−1), D2O (right image, 2500 cm−1), and the interface between the solvents (middle image) with Raman shift of both solvents, at different heights. The spatial separation is on the y axis, where each pixel corresponds to approx. 4 microns, with the magnification used. The spectra shown below each image are the sum of the whole or part of the image. (Photo) Analysis locations below, on, and above the meniscus.
Line-focused imaging is well suited to investigate mixing in microfludic channels as the line can be placed across its width. The mixing of identical solvent streams can be characterised using isotopologues of resonance Raman active compounds, as shown, for example, in Figure 1.
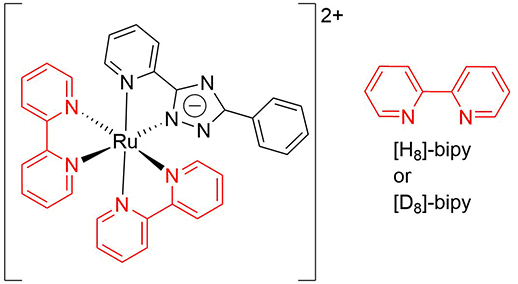
Scheme 1 Isotopically labelled ruthenium(II) complexes used for Raman imaging of mixing of solvent streams; [Ru([H8]bpy)2(bpt)](PF6) and [Ru([D8]bpy)2(bpt)](PF6), where bpy = 2,2’-bipyridine and bpt = 3,5-(bis)2’- pyridyl-1,2,4-triazolato anion.5
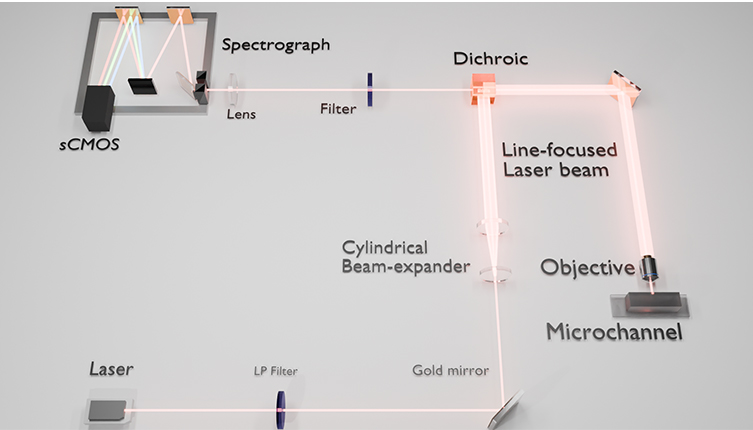
Fig. 3 Line-shape illumination on a microchannel, spectrometer layout, and optical arrangement used in the present study. The beam is expanded into an elliptical shape after the beam shaping lenses. The beam is then directed onto a microchannel, which results in a sheet of light over the width of the channel.
The Raman spectra were recorded using a line-focused laser, in this case at 473 nm (35 mW at sample, 04-01 series ’blues’, Cobolt lasers, Hubner group, Sweden) with the line generated with a combination of cylindrical and planoconvex lenses, Figure 3 held in rotation mounts to generate a near-collimated line oriented parallel to the spectrograph entrance slit.
Signals were collected using the optical configuration in Figure 3. A dichroic beamsplitter was used to bring the excitation beam, co-linear with the optical axis of the spectrometer, to the sample, through an 10x objective. The line’s length at the focal point was adjusted to be greater than the width of the channels imaged to have uniform intensity over the channel width. Raman scattering was collected in 180◦ backscattering mode and passed through a Rayleigh rejection filter before being focused with a 2.5 cm diameter (7.5 mm focal length) planoconvex lens into a Shamrock 303i spectrograph. The spectrograph was equipped with a Zyla 4.2-sCMOS camera (Andor Technology), as well as a 1200 l/mm grating blazed at 500 nm. The studied channel was made out of quartz and the channel has initially a smooth (featureless) section and then a section with herringbone grooves that form a static micromixer (Figure 1).
The isotopically-labelled complexes in Figure 1 show intense narrow Raman bands in water even at low (0.1 mM) concentrations due to resonance enhancement, Figure 4. Replacing hydrogen for deuterium causes the bands to shift to lower wavenumber and the Raman scattering from each complex can easily be resolved.
The streams containing either of the labelled compounds flow side-by-side in the smooth part of the channel, which can be seen in the Raman image showing spatial separation. When the two streams reach the static mixer structures in the channel, they start to mix and tumble around each other, asymmetrically, due to the offset of the apex of the grooves. The asymmetry is seen in the Raman images recorded at the apex of the first groove with one side seeming to mix first (middle image) by folding, or rotating, onto the second side. Then, during the second set of grooves the other side is mixed in as well, resulting in an apparent mixed flow. Using labelled compounds at low concentration means that the solvent streams are physically identical, i.e. without differences in osmotic pressure, phase separation, or reactivity between solvents and solutes.
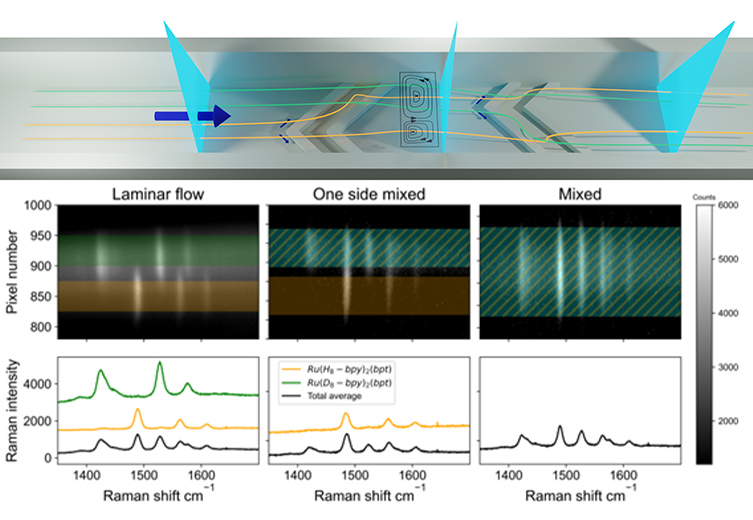
Fig. 4 (Top) Points analysed (vertical blue sheets) along the microchannel. The two solvent streams (purple and green) enter with side-by-side flow. The off-center apex of the grooves folds one stream over the other first followed by other stream folding over. (Bottom) Raman spectral images recorded with an sCMOS detector, (left) in the region of laminar flow , (middle) partial mixed flow in a microchannel and (right) fully mixed flow. The Raman bands for (orange) [Ru([H8]bpy)2(bpt)]+ and (green) [Ru([D8]bpy)2(bpt)]+ are observed due to resonance enhancement at 473 nm allowing them to be observed even at sub millimolar concentrations.
Raman spectroscopy provides a spectral fingerprint enabling label-free imaging used here to reveal mixing patterns in microchannels. Isotope labelling of solutes together with resonance enhancement enables the flow of otherwise identical solvents in side-by-side flow to be characterised in real-time analogous to the use of fluorescent probes.3
Despite that the sensitivity of sCMOS detectors is less than that with conventional CCD detectors, the present study shows that even in demanding applications, sCMOS is suitable for Raman spectroscopy. In contrast to CCDs shuttering during readout is not needed, since cross-talk/smearing and blooming are reduced by the mechanism of pixel readout in sCMOS chips. This readout advantage makes sCMOS useful for imaging applications such as the one described here.
Future research will focus on the use of the method described here to study reactions in flow. Chemical reactions proceed in time along the channel length. Variations in flow rate and focusing on different lengths along the channel may yield useful structural information on (transient-)reaction products. For a detailed account of this work see Klement et al.6
1. M. Mory, Fluid Mechanics for Chemical Engineering, Copyright © 2011 by John Wiley and Sons, Inc., 2013.
2. A. D. Stroock, S. K. Dertinger, A. Ajdari, I. Mezi´c, H. A. Stone and G. M. Whitesides, Science, 2002, 295, 647–651.
3. M. A. Ianovska, P. P. M. F. A. Mulder and E. Verpoorte, RSC Advances, 2017, 7, 9090– 9099.
4. N. Nitta, T. Iino, A. Isozaki, M. Yamagishi, Y. Kitahama, S. Sakuma, Y. Suzuki, H. Tezuka, M. Oikawa, F. Arai, T. Asai, D. Deng, H. Fukuzawa, M. Hase, T. Hasunuma, T. Hayakawa, K. Hiraki, K. Hiramatsu, Y. Hoshino, M. Inaba, Y. Inoue, T. Ito, M. Kajikawa, H. Karakawa, Y. Kasai, Y. Kato, H. Kobayashi, C. Lei, S. Matsusaka, H. Mikami, A. Nakagawa, K. Numata, T. Ota, T. Sekiya, K. Shiba, Y. Shirasaki, N. Suzuki, S. Tanaka, S. Ueno, H. Watarai, T. Yamano, M. Yazawa, Y. Yonamine, D. Di Carlo, Y. Hosokawa, S. Uemura, T. Sugimura, Y. Ozeki and K. Goda, Nature Commun., 2020, 11, 1–16.
5. W. R. Browne, N. M. O’Boyle, W. Henry, A. L. Guckian, S. Horn, T. Fett, C. M. O’Connor, M. Duati, L. De Cola, C. G. Coates, K. L. Ronayne, J. J. McGarvey and J. G. Vos, J. Amer. Chem. Soc., 2005, 127, 1229–1241.
6. N. Klement, E. Savino, W. R. Browne and E. Verpoorte, Lab Chip, 2024, DOI: 10.1039/D4LC00115J
Date: May 2024
Author: W.J. Niels Klement, Sabeth Verpoorte, Wesley R. Browne
Category: Application Note
