Resources
 Part of the Oxford Instruments Group
Expand
Collapse
Part of the Oxford Instruments Group
Application Notes
Author: Andor
Published: 10 Feb 2021 · Last updated: 25 Sep 2023
Tags: bs-sorting-quality
Spectral Flow Cytometry is a technique based on conventional Flow Cytometry where a spectrograph and multichannel detector (usually CCD) is substituted for the traditional mirrors, optical filters and photomultiplier tubes (PMT) in conventional systems. Flow Cytometry allows rapid multiparameter collection and analysis of data on single cells or particles.
Having a dispersive-optic based system provides a simpler setup whilst offering the possibility of using a higher number of measurement parameters. Conventional systems have been developed to offer higher numbers of simultaneously measureable parameters: systems with up to 19 parameters are available (direct scatter, side scatter and multiple fluorescence channels) but this requires multiple PMTs, filters, several lasers, multiple fluorophore labels and wavelength selective mirrors.
The problem that arises with trying to extend such systems to more channels, apart from the expense and the operating challenges, is the inherently broad fluorescence characteristics of the fluorophores. In this latter case, the more fluorophore fluorescent bands are used, the more overlapping of bands takes place and it becomes increasingly difficult to distinguish the individual signals on the different parameter channels. The use of a spectrograph with spectral deconvolution algorithms has the potential for a more comprehensive and flexible approach to multi-color or multiparameter analysis.
Two key technological developments have added a new impetus to the development of Spectral Flow Cytometry (SFC) instrumentation,
Several groups are working on Spectral Flow Cytometry, with some achieving multichannel detection using APD arrays or multianode PMTs. Others are using CCD detectors and are particularly looking at EM technology as a means of accessing the required speed, sensitivity and resolution. The aim of SFC systems is to provide high speed analysis rates and ultimately the possibility of cell/particle sorting. Currently, the analyses rates for spectral flow systems are relatively slow: this will form one of the key challenges going forward in the development of this technology.
The main focus by groups has been on the use of fluorescence spectroscopy. However, one group has now demonstrated a system using Raman spectroscopy – more specifically Surface Enhanced Raman Spectroscopy (SERS). Given the significant enhancement in signal possible with SERS, the SERS emissions can be of similar brightness to that of a typical fluorophore. In SERS, small nanoparticles are designed to give enhanced coupling of excitation energy to the species molecules of interest (via a process of plasmon resonance excitation) and the narrower bands of Raman signatures facilitate greater data multiplexing.
A schematic of a flow cell and the principle of hydrodynamic focusing of the fluid stream to give a series of single cells or particles for testing is shown in figure 1.
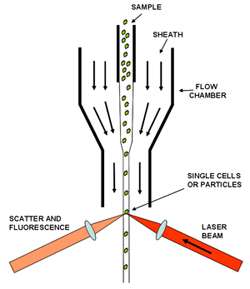
Figure 1: Schematic of Flow Cell
A hydrodynamic flow of fluid is used as a sheath which is focused into a narrower diameter flow which leads to separation of the cell or particle as they pass the test region of the flow cell. A laser is used to excite the spectroscopically active sites of the sample cells. There are two scattering parameters usually measured, 1) the forward scatter from the laser source, and 2) the side scatter which again will be at the wavelength of the laser. Allied with these are the spectroscopic signals which are usually fluorescence signals from the different fluorochromes; these signals are taken off in the side channel usually at 90o to the direction of the excitation laser.
In the conventional flow cytometer, the fluorescence signals are separated out into particular bands using a series of edge filters and dichroic mirrors and each individual channel is measured with a PMT. However, in the spectral flow cytometer, as described here, the side scattered light including fluorescence is collected and coupled into a spectrograph – either directly or through an optical fibre – where the whole light signal is dispersed and displayed as a high resolution spectrum on the CCD or multichannel detector. Raman spectra have also been measured in such systems.
Figure 2 below shows a schematic configuration for a spectroscopically-based flow cytometer. It is a plan view and the flow of the fluid channel is into the page. The laser is focused into the flow cell to ensure maximum efficiency in terms of excitation coupling: in some configurations crossed cylindrical lenses are used to define a rectangular region of interest for ‘interrogating’ the sample cells as they flow through. Forward scatter as a key parameter is usually measured with a photodiode (PD) or photomultiplier tube (PMT). A beam stop is incorporated into this optical path to cut out the direct laser light and protect the detector. This parameter is particularly important in terms of information on the size of the scattering particles.
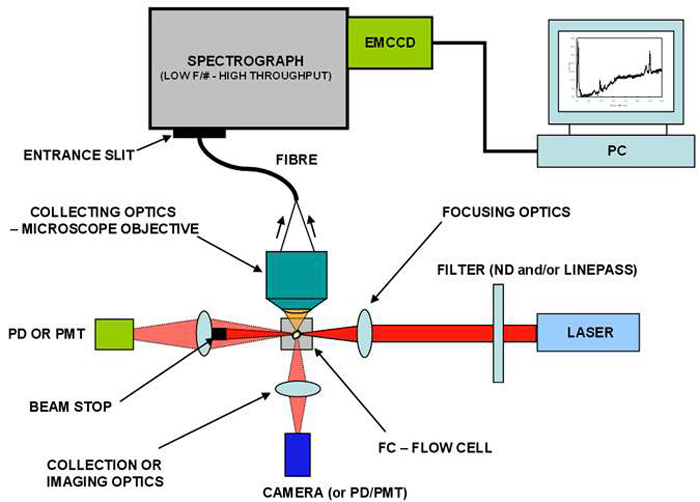
Figure 2: Schematic of Spectral Flow Cytometer
In this schematic, some imaging optics and a camera are located to the side to facilitate with alignment of the sample and laser. The side scatter and spectral signal (including fluorescence or Raman) is coupled through a microscope objective into an optical fibre in this case, which in turn delivers the optical signal to a high throughput spectrograph. Some geometries couple the light directly into the spectrograph via collection optics i.e. no fibre.
Explore our related assets below...

© Oxford Instruments 2026
