Resources
 Part of the Oxford Instruments Group
Expand
Collapse
 Part of the Oxford Instruments Group
Fluorescence spectroscopy is a widespread and powerful technique that can be applied to studies of large biomolecules and their interactions. In particular techniques using the Fluorescence Resonance Energy Transfer (FRET) combined with encoded nanocrystal fluorescent microbeads are now being explored as a potential means of developing early diagnostic devices/systems for medical applications.
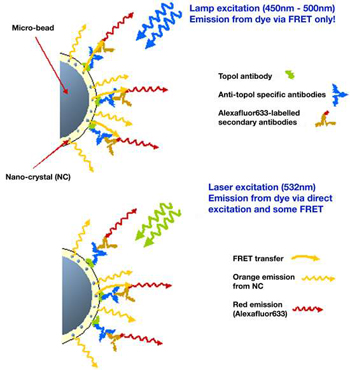
A schematic of an example application using fluorescence spectroscopy with a micro-bead assay is illustrated in figure 1 below. This experiment sets out to demonstrate how nanocrystals combined with FRET spectroscopy, could act as a detector for the presence of auto-antibodies. Auto-antibodies can act as markers of disease developing in healthy individuals.

Figure 1: Schematic of the FRET process
This example [from ref. 1] looks at the human antibody, topoisomerase or Topo I (shown as green molecule in figure 1).The test is to detect the presence of anti-Topo I antibodies (blue molecules in the figure).
Samples are prepared such that the Topo I antibody molecules (green) are attached to the microbeads in proximity to the nanocrystals. When these are incubated with anti-Topo I antibodies (blue), the latter attach themselves to the Topo I molecules. Following further incubation with a solution containing dye labeled (Alexafluor633) secondary antibodies (brown), further binding occurs, as illustrated in the figure, which facilitates a FRET path between the donor excited nanocrystals and the receptor dye molecules.
When illuminated with the broadband lamp (450 nm-500 nm), the emission from the dye molecules (red) is mediated via FRET due to close proximity from the binding. If the anti-Topo I antibodies are absent no binding will occur and there will be no emission from the dye molecules attached to the secondary antibodies which will move freely in the solution. The presence of the latter can be confirmed by direct excitation with the laser source at 532 nm.
In-depth details on this proof-of-principle technique, as demonstrated by Alyona Sukhanova et.al. can be found in reference 1.

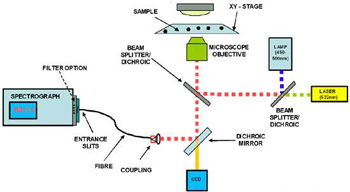
Figure 2: Configuration of a typical setup for FRET spectroscopy
A typical setup is illustrated in figure 2 above, showing the main components of a spectrograph, highly sensitive detector, microscope with adjustable x-y sample stage, a selection of excitation sources and a means of coupling the light from the output of the microscope into the spectrograph (in this case via a fibre). Other configurations include a scanning confocal microscope setup and coupling of the light signal, after the confocal aperture, into a fibre for delivery to the spectrograph. Other configurations use direct coupling of the light via relay optics from the exit port of the microscope to the entrance slits of the spectrograph.
Reference Material
Alyona Sukhanova, Andrei S. Susha, Alpan Bek, Sergiy Mayilo, Andrey L. Rogach, Jochen Feldmann, Vladimir Oleinikov, Brigitte Reveil, Beatrice Donvito, Jacques H.M. Cohen, and Igor Nabiev, ‘Nanocrystal-Encoded Fluorescent Microbeads for Proteomics: Antibody Profiling and Diagnostics of Aitoimmune Diseases’, Nano Lett., 7 (8), 2322 -2327, 2007. 10.1021/nl070966+ S1530-6984(07)00966-6
Medintz IL, Clapp AR, Mattoussi H, Goldman ER, Fisher B, Mauro JM, ‘Self-assembled nanoscale biosensors based on quantum dot FRET donors’, NATURE MATERIALS 2 (9): 630-638 SEP 2003
Marcel Bruchez Jr., Mario Moronne, Peter Gin, Shimon Weiss, A. Paul Alvisatos, ‘Semiconductor Nanocrystals as Fluorescent Biological Labels’, Science 281, 2013 (1998)
