Resources
 Part of the Oxford Instruments Group
Expand
Collapse
 Part of the Oxford Instruments Group
The most important figure for our spectroscopy users is Spectral Resolution. This is a measure of how finely a spectrometer can resolve spectra. It’s often given as a single number – the “width” in nanometers of a very narrow spectral line measured with a specific spectrometer, grating and camera. Confusingly, “high” spectral resolution means a low number and very narrow spectra.
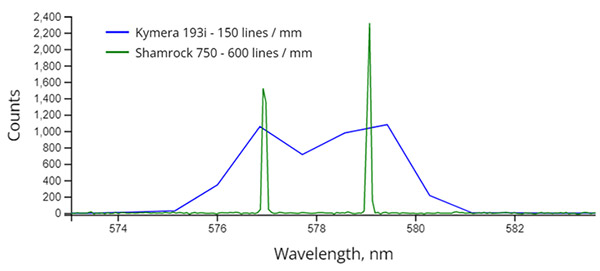
As an example, below is a simulated mercury lamp spectrum as viewed through two differently-configured spectrometers: a Kymera 193i and 150 line / mm diffraction grating (spectral resolution 2.44 nm), and a Shamrock 750 with a 600 line / mm grating (spectral resolution 0.11 nm). The spectral lines appear significantly narrower on the Shamrock 750 – although the “real” linewidth is actually orders of magnitude lower. The broader measured lines on the Kymera 193i begin to overlap – at an even broader resolution, they will merge and can no longer be measured separately.

Our Resolution Calculator will estimate spectral resolution, bandwidth, and dispersion using the grating equation, but we’re commonly asked how slit width, spectrometer imaging performance, and detector pixel size affect this.
There are some key guidelines:
One way of thinking about why this may be the case is considering what the spectrometer does on an optical level. The mirrors inside serve to re-focus the image of the slit onto the detector. It’s never a perfect image - any real-life imaging system spreads out an infinitesimal point of light at its entrance into an imperfect blob of light at the output. This point-to-blob mapping is called the Point Spread Function (PSF).
Because the diffraction grating reflects light at an angle as a function of its wavelength, a replica of this slightly-fuzzy slit image is created for each wavelength present in the light entering the spectrometer. How “spread apart” these images are is a function of the spectrometer’s dispersion.
Spectral Resolution is a measure of how close two of these images can be before overlapping so much they can’t be separated. A small, sharp PSF and high dispersion make it easier to separate two parts of a spectrum very close in wavelength.
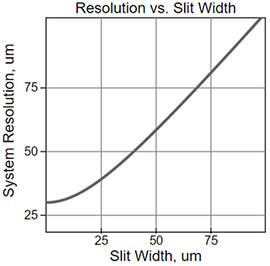
Small slit widths also help by keeping the illuminated part of the slit very narrow. However, below a certain slit size we find the limit of the PSF - and diffraction too, eventually. This explains the “bent” appearance of the relationship between slit width and resolution. At very small slit widths, the fixed PSF dominates, then at larger slits widths the resolution is directly proportional to the slit width, as the contribution of the PSF is very small.

Finally, once the image is formed at the detector, it gets “diced up”, or quantized, into pixels. Once light is absorbed at a pixel, all spatial info at a smaller scale than the pixel size is lost - we only know a photon was detected somewhere within the pixel. This reduces the spatial resolution – and in our spectrometer this means spectral resolution. Large pixels cast a physically wider net and collect more light in proportion to their area, but add spatial uncertainty. Smaller pixels “sample” the image more faithfully.
Below is a simulation of the effect of slit width, pixel size, and point spread function on a model spectra consisting of three identical, closely spaced spectral lines.
| Slit Width, μm | 10μm | |
| Pixel Size, μm | 6.5μm | |
| PSF Width, μm | 30μm |
Date: April 2023
Author: Dr. Adam Wise
Category: Technical Article
