Resources
 Part of the Oxford Instruments Group
Expand
Collapse
 Part of the Oxford Instruments Group
A diffraction grating is an optical element, which separates (disperses) polychromatic light into its constituent wavelengths (colors). The polychromatic light incident on the grating is dispersed so that each wavelength is reflected from the grating at a slightly different angle. The dispersion arises from the wavefront division and interference of the incident radiation from the periodic structure of the grating.
The dispersed light is then re-imaged by the spectrograph and the required wavelength range is directed to a detection system. Gratings consist of equally spaced parallel grooves, formed on a reflective coating and deposited on a substrate. The shape of the grooves (blaze angle) influences what wavelength range the grating is best optimised for.
The dispersion and efficiency of a grating are dependant on the distance between adjacent grooves and the groove angle. Gratings are generally better than prisms - they are more efficient, they provide a linear dispersion of wavelengths and do not suffer from the absorption effects that prisms have which limits their useful wavelength range.

The dispersion of a grating is governed by the grating equation, usually written as:
n ⋅ λ = d ⋅ (sinθi + sinθd)
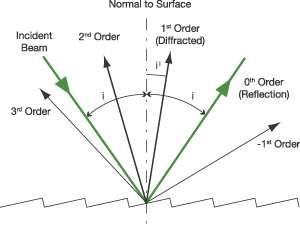
where: n is the order of diffraction, λ is the diffracted wavelength d is the grating constant (the distance between successive grooves) θi is the angle of incidence measured from the normal and θd is the angle of diffraction measured from the normal. The diagram above shows the orders of the diffracted wavelength. As well as positive orders, light can also be diffracted in the opposite direction (i.e. n = -1, -2 etc.) Higher orders may also appear, but these decrease in intensity. Usually the first order lines (n=1 or n=-1) are the most intense.

The key parameters to consider when selecting a grating for a given application are
These influence the choice of grating line density, blaze angle/wavelength, master (different masters for a given line density and blaze angle yield different efficiency and polarisation characteristics) and grating size.
Expected spectral resolution and simultaneous bandpass are also influenced by how light is coupled into the spectrograph, the central wavelength of interest and associated grating “working angle”, as well as the detector pixel array format at the output plane. Some of these trade-offs can be assessed with the Andor resolution calculator for Kymera and Shamrock Czerny-Turner spectrographs.
