For the development of biologics, genetically modified cell lines are often used to efficiently produce therapeutic proteins. The determination of high‐producer cell clones and the up‐scaling of such cell lines is a very time consuming and costly process. An automated identification and selection of efficiently producing single cells can significantly accelerate this process.
The OptisCell process is intended to reduce the time needed to identify a cell line from twelve to three months. Raman spectroscopy is used here for the marker‐free functional identification of the protein producing cells. Afterwards those cells are isolated with a laser‐based single cell transfer process. This reduces number of expansion and cultivation steps for cell clones that have insufficient production rates. Suitable cell candidates for biotechnological production can thus be selected much earlier than in the conventional process. The automated process chain of OptisCell makes it also possible to screen for a large number of candidates and to accurately track the process for later quality control.
In a first step of the OptisCell process, single cells in a cell pool are analyzed for their production of a specific protein using a HoloSpec Raman spectrometer. The system uses machine learning algorithms to distinguish the Raman spectra of producing and non‐producing cells. In the second step, the high producer cells are transferred to a microtiter plate using a laser pulse.
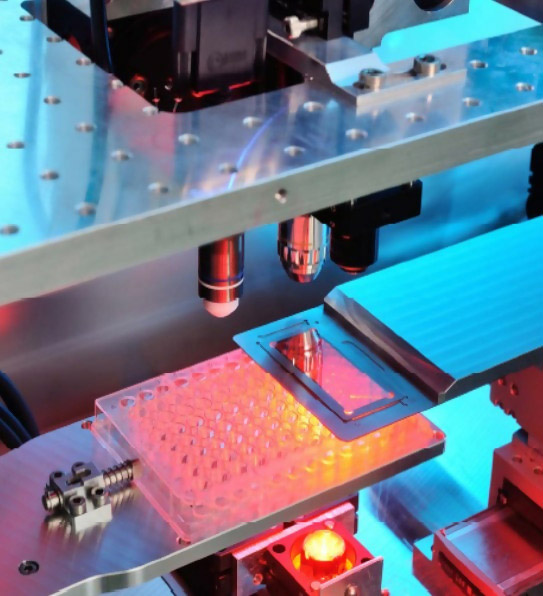
The process is termed Laser Induced Forward Transfer (LIFT) in which an absorber layer on the carrier is vaporized with a laser pulse. The small vapour bubble creates a jet in the medium (e.g. hydrogel), thus transferring the selected cell to the microtiter plate. This process chain allows for the quick and automatic identification of high‐producer cells, and to select them from the cell pool for further cultivation. A picture of the OptisCell process chamber is shown in Fig. 1.
Fig.1: Process chamber for Raman spectroscopy and LIFT process. With microtiter plate as receiver and glass cover slip as transfer carrier.
Method
As a preliminary test for the automated high‐producer cell identification existing Raman spectra of Interferon beta producing CHO cells (Chinese hamster Ovary Cells CHO dhlr‐ INFβ) were provided by the Fraunhofer IGB and analysed with machine learning software of Fraunhofer FIT. The Raman spectra from potential high‐producer cells are first subjected to preprocessing, which frees the spectra of interfering signals – such as cosmic spikes, white noise and further background signals.
Thereafter feature dimensions are reduced with PCA (Principle Component Analysis) and four independent models with a weighting method are used to decide which spectra contain high producer cells.
To validate the capabilities of the build‐in Raman spectrometer of the OptisCell machine fluorescence microspheres with a diameter of 8 μm (Dragon Green Fluorescent Polymer Microspheres FSDG007, Bangs Laboratories, Inc.) are analysed.
First a transfer carrier is prepared by blade‐coating a glass cover slide with a 50 μm thick gelatin layer (5% gelatin from bovine skin, G9391, Sigma Aldrich) and fluorescence microspheres are applied to the top of the hydrogel layer. To allow the microspheres to settle, the suspension is left on the transfer carrier for four minutes. The excess suspension is then removed and the transfer slide is placed in the OptisCell machine. A 10x objective (MSPlan 10, NA 0.3, Olympus) is used to scan the transfer slide and to locate isolated fluorescence microspheres for the Raman analysis. The Raman spectrum is taken using a 785 nm laser source (iBeam smart 785‐S‐WS, Toptica), a 50x objective (50x MPlanFL N, NA 0.8, Olympus), and the HoloSpec Spectrometer (HoloSpec f/1.8i – NIR, LOT with iDus 416 CCD, Andor) in a confocal Raman setup. After recording the Raman spectra are subjected to a preprocessing step, which normalizes the spectra and subtracts background signals.
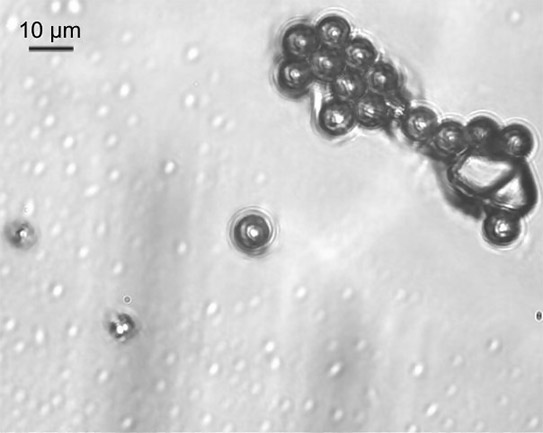
Fig. 2: Picture of fluorescence microspheres taken through the Raman optic of the OptisCell System.
Results
We were able to precisely target individual microspheres with the OptisCell system and measure them with the HoloSpec Raman spectrometer. An exemplary spectrum is shown in Fig. 3. The characteristic peaks of the polystyrene of the fluorescence microspheres can be clearly identified without a high levels of signal processing. The automated detection of protein‐producing cells using prerecorded Raman spectra from potential high‐producer reaches an accuracy with which cells are recognized as true high‐producers up to 92 percent. An exemplary result is shown in Fig. 4. There the machine learning software correctly identified the spectrum of a single protein‐producing cell in a pool of 26 cell spectra.
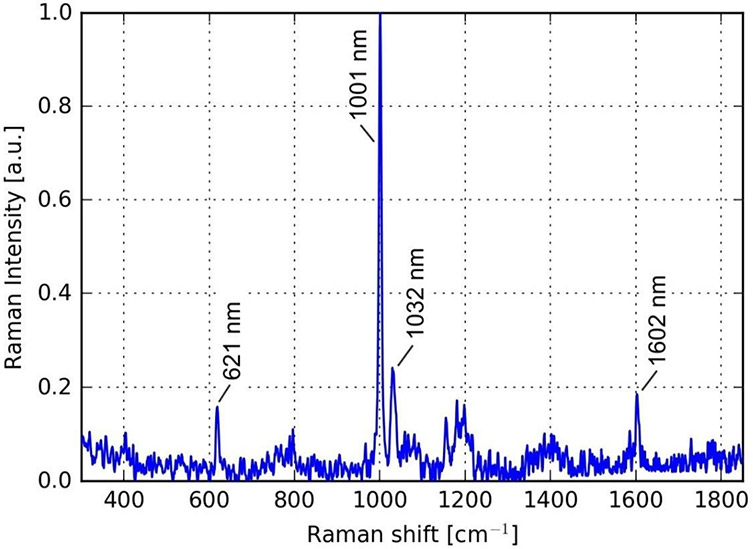
Fig. 3: Raman Spectrum of a single fluorescence microsphere showing characteristic peaks of the Polystyrene in the microsphere
Conclusion
The OptisCell system is a machine for the time‐ and cost‐efficient development of protein‐producing cell lines. We have shown that the build‐in Raman spectrometer of the OptisCell‐System is capable of analyzing small objects with a sufficient Raman intensity. Furthermore the automated detection of protein‐producing cells via Raman spectroscopy reaches an accuracy with which cells are recognized as true high‐producers up to 92 percent.
In further studies the automated detection of protein‐producing cells will be implemented into the OptisCell‐System to realize the entire process in one machine.

Fig. 4: Raman spectra of 25 low‐producer or no‐producer cells (blue) and one high‐producer cell (red). In the top right corner the dimension‐reduced feature space of the PCA is depicted.