Resources
 Part of the Oxford Instruments Group
Expand
Collapse
 Part of the Oxford Instruments Group
Quantum optics schemes based on semiconductor materials are gaining importance in quantum cryptography and quantum communication applications and research. In this application note, we present spectroscopic measurements on GaAs exciton polaritons and InAs quantum dots. All experiments were carried out at cryogenic temperatures, in the range of 4 to 60 K.

Fig. 1: Quantum dot micro-photoluminescence setup showing the cryostat, the microscope objective, and various excitation beams.>
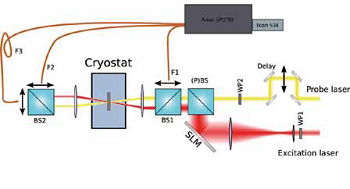
Figure 2: Schematic view of the experimental setup. The spatial light modulator (SLM) steers the excitation and beam, while the wave plates control the polarisation. In one of the beams, an additional delay is inserted to facilitate pump-and-probe measurements. The luminescence is collected by optical fibres F1, F2, and F3, and is fed into a spectrometer.
Owing to the fact that interfacing to existing electronic components is comparatively simple, semiconductor optics has always been a strong contender amongst the implementations of light-matter interfacing. This is also true in the new paradigm of quantum optics, where the quantum properties of light are to be converted to electronic signals, or electronic signal is turned into light of quantum nature.
Possible realisations of a quantum emitter are based on exciton-polaritons, or semiconductor quantum dots (QD). In the first case, the interaction of a narrow quantum well and the surrounding cavity gives rise to exotic states of light, and the emitted photons can be entangled (Romanelli et al., Towards quantum correlated polariton modes in semiconductor microcavities Journal of Optics B: Quantum and Semiclassical Optics, 2005, 7, S523, and Diederichs et al., Parametric oscillation in vertical triple microcavities Nature, 2006, 440, 904), while in the latter case, a true, and on-demand entangled photon source can be realized (R. M. Stevenson et al., A semiconductor source of triggered entangled photon pairs, Nature 439, 179, 2006). In order to gain access to the relevant physical parameters of the system, we resort to spectroscopic measurements.
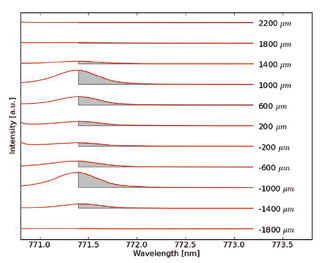
Fig 3: Polariton luminescence as a function of the position of F1 in Fig. 2. The spectra are integrated over the shaded intervals, and the integral is plotted in Fig. 4.
Our experimental setup is based on pulsed Ti-Saph lasers, a spatial light modulator (SLM), which serves as a means of convenient beam steering, a cryostat keeping the sample temperature at 5 K , light collection optics, a Roper Scientific Acton SP2750 imaging spectrometer, and an Andor iKon-M DU934N-BR-DD CCD camera. In the polariton experiments, in order to measure the properties of the embedding cavity, light is collected by optical fibres in either reflection, or transmission configuration. In other cases, and in the quantum dot experiments, the luminescence is measured. By making use of the fibres, we can spatially select the light collection point, which then carries information on the momentum of the electronic particles in the sample, or the alignment of the emitter (QD) with respect to the cavity.
On Fig. 3, we show a typical polariton emission spectrum. The sample is excited off-resonantly, and emission is collected by fibres placed at specific positions. As pointed out before, by moving the fibres, we can relate the spectrum to the momentum of the electronic particles in the sample. In this way, we can reconstruct the whole dispersion relation. Such a reconstruction is demonstrated in Fig. 4.
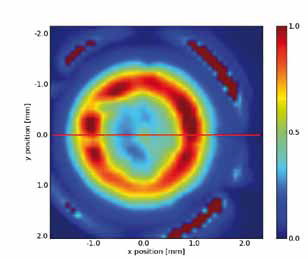
Fig. 4: Reconstructed luminescence intensity as a function of polariton momentum. Again, spatial position translates to momentum. The intensities are taken from integrated spectra similar to those shown in Fig. 3.
Fig. 5 shows a typical QD spectrum, taken with a 1800-lines/mm grating. In addition to the exciton and biexciton lines, the emission of other charged particles can also been recognized.
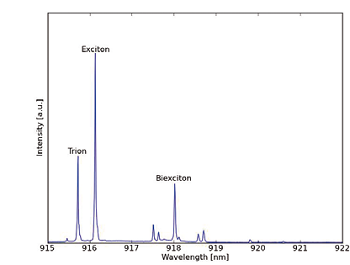
Fig. 5: Luminescence spectrum of an InAs quantum dot. The trion, the excitons, and the biexciton lines are annotated, the other lines are related to other charges irrelevant in the experiments.

Figure 6: Exciton emission of a different quantum dot (left hand side blob), and cavity resonance (right hand side blob)
In Fig.6, we projected the luminescence signal onto the slit of the spectrometer, i.e. in this case, for spatial selection, we used the position on the slit instead of moving the fibres. On the left hand side, the QD emission can be seen, while the spot on the right can be identified as the slightly detuned cavity. The two signals are displaced in the vertical direction, because the QD luminescence direction is not aligned with the cavity’s normal.
