Resources
 Part of the Oxford Instruments Group
Expand
Collapse
 Part of the Oxford Instruments Group
When electrons in materials are excited by x-rays, the material can return to the ground state by re-emitting photons and electrons. Analyzing the energy of emitted photons and comparing that with the energy of excitation photons has been one of the most direct ways to study the electronic structures of materials.
These photon-based techniques include the x-ray absorption spectroscopy (XAS, in partial fluorescence yield mode PFY-XAS), x-ray emission spectroscopy (XES), and resonant inelastic x-ray scattering spectroscopy (RIXS). [1] Depending on the excitation photon energies, they can provide the information of occupied and unoccupied projected density of states (pDOS), elementary excitations (phonons, magnons, orbital excitations) … etc. The electronic structures, unique to the materials under study, determine the physical and chemical properties. The photon spectroscopies are extensively used in synchrotron facilities around the world, and they are now finding more and more applications in applied science with lab-based soft x-rays sources.
In the soft x-ray regime (photon energies below ~ 2 keV), a reflection grating is often used to analyze the energy of photons. Here we show a novel design of a grating-based soft x-ray spectrometer that utilizes the Andor ikon CCD detector (DO 936-BN). [2]

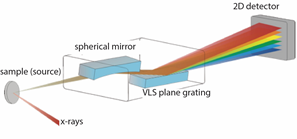
Figure 1: Schematic plot showing the Hettrick-Underwood optical scheme.
Modular x-ray spectrometer (MXS)
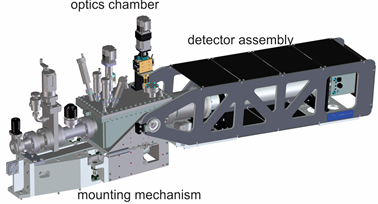
The spectrometer uses the Hettrick-Underwood optical scheme with two optical elements (see Figure 1): a spherical mirror for focusing the emitted x-rays from the sample onto the detector and a set of varied line spacing (VLS) plane gratings for dispersing photons with different energies, imaging the virtual source created by the spherical mirror, and correcting the aberrations from both optical elements. The spectrometer is designed to be modular with moderate resolving power (defined as the energy over resolution, or E/?E). It consists of three major components: an optics chamber that holds the aforementioned optical elements, a detector assembly where CCD is attached to, and the mounting mechanism to attach the spectrometer to the experiment endstation. The CAD model of this spectrometer is shown in Figure 2. Using Andor DO936-BN CCD, the straight beam test where the highly collimated synchrotron x-ray beam passing through a 25 micron pinhole serves as the virtual source demonstrates a ~ 1,600 resolving power at 500 eV photon energy.

Figure 2: CAD model of the modular soft x-ray spectrometer. [2]
RIXS map of battery cathode material Li(Ni,Co,Mn)O2
Despite having a moderate energy resolution with Andor CCD, the Hettrick-Underwood optical scheme gives the large flat field imaging capability. In addition, the optical design optimized for high throughput enables the researchers to record the very weak (small cross-section) RIXS spectra in a much shorter experimental time. This is shown in Figure 3 where experiments were performed on battery cathode material Li(Ni,Co,Mn)O2 at beamline 8.0 of the Advanced Light Source (ALS), Lawrence Berkeley National Laboratory.

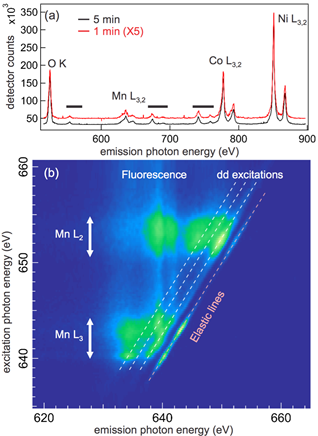
Figure 3: (a) XES spectra of LiNi1/3Co1/3Mn1/3O2 taken at 900 eV excitation photon energy with 300 seconds (black) and 60 seconds (red, magnified by a factor of 5) measurement time. (b) RIXS map with excitation photon energy scanned through Mn L2,3 edges (from 635 eV to 660 eV). The elastic line and localized dd excitations are marked by pink and white dashed lines, respectively. The vertical broad lines are the non-resonant fluorescence features. [2]
In Figure 3(a), we show the normal XES spectrum with excitation photon energy tuned to 900 eV, far above the resonances of transition metal elements (Ni, Co, and Mn) in this material. As one can see, the spectral window is nearly 400 eV wide, from ~ 500 eV to 900 eV. In this energy window, x-ray emissions from key transition metal element Ni, Co, and Mn, and O can be recorded simultaneously. In addition, these spectra features could be resolved within just 1 minute of exposure time and the high statistics spectrum only takes 5 minutes to acquire. The emission intensity is strong enough that the much weaker L2,3 – M1 decay channels can also be observed. This enhanced detection efficiency of this spectrometer makes the XES a viable technique to complement the XAS that is commonly used in materials research.
When the excitation photon energies are tuned to the elemental absorption edges, say Mn L2,3 edges, in this case (transitions from Mn 2p1/2, 3/2 to 3d states), resonance enhancement makes the weak localized excitation features visible in the RIXS spectra. In Figure 3(b), we show a RIXS map consists of RIXS spectra taken with 0.2 eV excitation energy step from 635 eV to 660 eV (126 spectra). The acquisition time for each spectrum is 2 minutes, and the entire map takes about 4 hours to complete. Despite taking such a long time to produce a map over the RIXS spectra at few selected excitation photon energies (this is a common practice in recording the RIXS spectra today because of the long acquisition time for each spectrum), one can already see the potential of the RIXS maps. Several spectral features can be easily identified in the map: the strong diagonal line is the elastic peak (emission photon energy is equal to the excitation photon energy, or zero energy loss), and several parallel lines are the Raman-like transitions between Mn 3d orbitals (called dd excitations, which are the optical forbidden transitions between 3d orbitals). The strong vertical stripes, with intensity enhancement above the Mn L3 absorption edge, are the normal fluorescence from Mn 3d band transitions. The fluorescence and dd excitations can mix up with each other around the Mn absorption edges, making them hard to be distinguished in the energy-integrated probe like XAS (integrated over the emission energy; or horizontally in this map). But they are clearly visible in the RIXS maps.
This finding has recently called for re-examination of the interpretation of XAS spectra recorded using the energy integrated photon detectors, as some of the spectral features can come from enhanced localized excitations rather than the pristine band transition. [3] It nevertheless demonstrates the importance of using RIXS maps to study correlated, functional materials where spectral lineshape interpretation plays a key role in elucidating the underlying electronic structures.
This work described was supported in part by the U.S. Department of Energy, as awarded under Contract No. DE-AC02-05CH11231. While this document is believed to contain correct information, neither the United States Government nor any agency thereof, nor the Regents of the University of California, nor any of their employees, makes any warranty, express or implied, or assumes any legal responsibility for the accuracy, completeness, or usefulness of any information, apparatus, product, or process disclosed, or represents that its use would not infringe privately owned rights. The views and opinions of authors expressed herein do not necessarily state or reflect those of the United States Government or any agency thereof or the Regents of the University of California. The Regents of the University of California, Lawrence Berkeley National Laboratory is not affiliated with Andor and does not support, endorse, or sponsor Andor or its products/services.
Reference
