Resources
 Part of the Oxford Instruments Group
Expand
Collapse
 Part of the Oxford Instruments Group

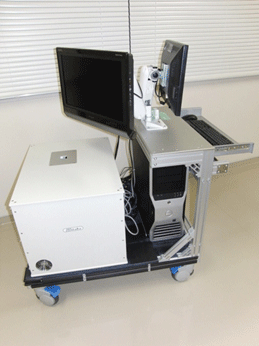
Figure 1: Picture of the hyperspectral analyser
Hyperspectral imaging is being used as a basis for clinical diagnostic tools. An example of its application is the identification of malignant melanoma when investigating pigmented skin lesions. The main cause of melanoma is believed to be due to UV radiation from over exposure to the sun or overuse of sun-beds. Melanoma are responsible for most deaths which occur due to skin cancer. However, if melanoma are diagnosed and treated in the early stages, the outlook is good with a high chance of being cured. A Japanese group [1] have developed a system using a grism based hyperspectral spectrometer with an EMCCD camera to capture hyperspectral data from skin lesions, which upon analysis allowed them to distinguish between malignant melanoma and other skin lesions in a numerical and objective way.
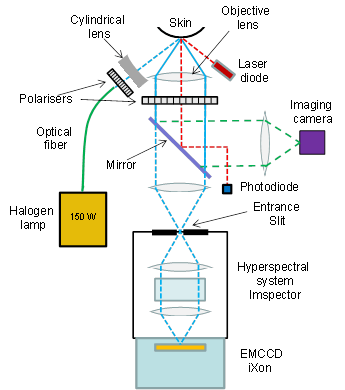
As part of this work, Nagaoka and co-workers [1], defined and tested a discrimination index which they applied to the hyperspectral data to extract the key information required to make a diagnosis. A picture of the instrument developed by the group is shown in Figure 1 and a schematic of the main components is illustrated in Figure 2.

Figure 2: Schematic of system layout
Hyperspectral data sets or ‘cubes’ have a full spectrum of the relevant wavelength region associated with each pixel element of the sample field of view. Nagaoka et al. imaged the sample – areas of skin with lesions – on to the entrance slit of a high resolution spectrometer, an Imspector V8E model from Specim [2]. The spectrometer dispersed the light from the slit on to the CCD sensor so that spectral data corresponding to each spatial point along the length of the slit was displayed across the sensor, giving spectral information in one dimension and spatial in the other. An iXon (DU-897E-BV) EMCCD camera was the camera of choice with its offering of high sensitivity and speed; its sensor size matches closely the FOV presented by the spectrometer. To build the full data cube for the area of interest, the slit/spectrograph was scanned across the sample with the CCD acquisitions synchronized to capture data from successive line sections down the sample. The system had a 5x imaging objective at the front which gave typically a 6 mm x 6 mm image of the sample at the entrance slit plane. Data was collected at a frame rate of 30 fps for a spectral range of 380 – 780 nm, with a spectral resolution of ~2.4 nm and a spatial resolution of ~13 μm. A full hyperspectral image was acquired in ~20 s. A broad band halogen lamp coupled through an optical fiber and focused with a cylindrical lens was used to illuminate the skin sample area. Crossed polarizers were used to select the diffusely reflected light for imaging in preference to the spectral reflection. A mirror can be switched in and out when choosing between either hyperspectral capture or just imaging the sample area with an imaging camera.

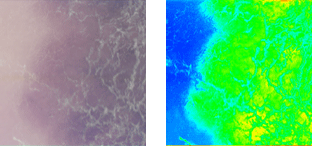
Figure 3: A standard dermoscopy image of a skin lesion (melanoma) is shown on the left and the derived hyperspectral image is shown on the right.
Malignant melanoma as evidenced with dermoscopy and histopathology tend to show higher degrees of disorder, irregularity, variation in melanin (pigment) and haemoglobin densities, and variation in morphology, compared with other skin lesions. Nagaoka et al. proposed a melanoma discrimination index which was designed to highlight such distinguishing differences between malignant tissue and others types of skin lesions such as seborrheic keratosis, nevus cell nevus and Spitz nevus. Their algorithm was defined to determine the spectral similarity between two spectra, one being the measured raw spectrum at a given point in the sample and the other a reference spectrum from normal skin, resulting in a 2D ‘spectral angle map’ for the full hyperspectral data set. Figure 3 shows a standard dermoscopy image of a malignant melanoma and the derived 2D ‘spectral angle map’.
The final discrimination index was derived from the image entropy of the ‘spectral angle map’ [3]. In short the calculated index was a measure of the degree of variegation in the spectra; a high degree of variability from point to point in the sampled region showing up as a relatively high index and thereby suggestive of malignant melanoma.
The key advantages of hyperspectral imaging compared with conventional dermoscopy are,
The early detection of cancer not only improves significantly patient care and the chances of a cure, but also has major impact in term of cost savings with early intervention.
References
