Resources
 Part of the Oxford Instruments Group
Expand
Collapse
Part of the Oxford Instruments Group
Expert Insights
Author: Andor
Published: 10 Feb 2021 · Last updated: 28 May 2026
Webinar: Raman Spectroscopy - A New Dawn In Clinical Diagnosis
Echelle Spectograph
An Echelle spectrograph disperses the light in two orthogonal directions using two dispersion stages. We can denote these as the X and Y directions. Echelle in French means a ladder, hence the connotation here where the spectral orders correpsond to the rungs of the ladder as a result of the dispersion in the vertical and horizontal directions. As a result, the spectral data is displayed as a 2D pattern and can be ideally captured with a 2D detector such an imaging CCD camera.
Echelle spectrographs are similar in some respects to Czerny Turner spectrographs, but they do have two dispersive components which can be either two gratings or two prisms or a combination. The two dispersive elements are arranged to disperse the light in two perpendicular or orthogonal directions. Consequently echelle spectrographs can be designed to give simultaneously high spectral resolution and large spectral bandpass. This is one of the key design and performance features of the Mechelle 5000 spectrograph from Andor Technology.
This contrasts with the traditional Czerny-Turner design where there is a trade-off between bandpass and spectral resolution: as one configures the system for high spectral resolution, a consequence is a smaller bandpass - analogous to zooming in on a small size spectral window. There are application situations where it is desirable to have a large spectral bandpass and high spectral resolution at the same time. One such example is in Laser Induced Breakdown Specroscopy (LIBS). LIBS is techniques where one can identify the chemical elements within a material by using a focused laser to produce a highly ionised micro-plasma of the material - which, upon recombination, emits lots of atomic emission lines characteristic of the elements in the material.
In most Echelle spectrograph designs there are no moving parts, which results in a robust design lending itself to incorporation into portable systems and systems needed in 'hostile' environments. The sytems can be configured to provide convenient calibration and fast analysis making them suitable for 'in-the-field' types of application.
Optical Layout
Figure 1 shows the optical layout of the Mechelle 5000 spectrograph design from Andor Technology.
As can be seen, this is an has an off-axis design. As with Czerny-Turner designs, off-axis geometries will suffer from aberrations such as coma, which will compromise the performance unless the design includes features to counter the effects. The Mechelle has several optical components designed to minimise the effects of aberration. This ensures the spots corresponding to each individual wavelength are well-focused at the output focal plane - a key requirement to ensure a) good resolution and b) minimal crosstalk or spectral contamination between the neighbouring spectral orders.
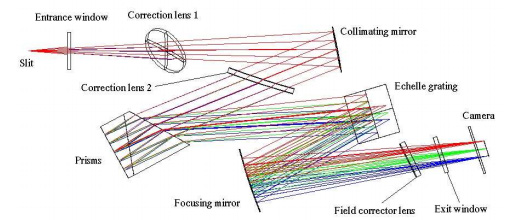
Fig.1 Optical layout of the Mechelle 5000 echelle spectrograph
Andor has introduced a patented design which introduces two correction lenses which correct for these aberrations.
Another unique feature of the design is the use of the dual-component prism, rather than the commonly used single-piece prism design. The dual-piece prism, which consists of two prisms of slightly different refractive index, disperses the light at the first dispersion stage into spectral orders running up/down the focal plane as shown in figure 2. With a single prism the spectral orders tend to get closer together as one moves towards the NIR region of the spectral range. The dual-prism keeps the spectral orders well separated throughout the full spectral range, which is important for minmising crosstalk effects between the spectral orders. Figures 2a and 2b show the difference in the spectral order pattern with the two different prism designs - 2a being single prism and 2b being dual-piece prism.
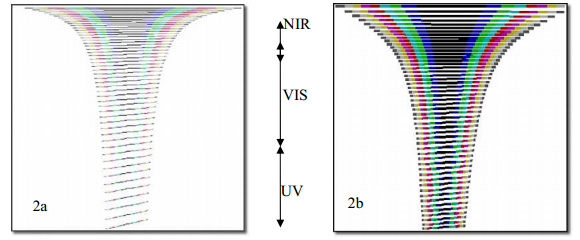
Fig.2 2a and 2b show the Echelleogram as seen on the detector when the croo-dispersing prism used in the optical layout of an Echelle spectrograph is Signle-Order and Dual-Order respectively. The distribution of wavelength regions across the height of the detector has also been shown.
Andor’s patented design for the dual-piece prism minimises the potential for any crosstalk. The close spacing un-even distribution of orders leads to close stacking-up of orders in the visible and NIR regions. Signal belonging to these two regions is quite likely to be simultaneously hitting several orders, leading to the formation of ghost lines. Besides, uneven distribution of orders also leads to variable magnitudes of cross-talk. Both these effects adversely affect the use of the Echelle instrument.
Andor’s Dual Order Prism design circumvents these issues by evenly spreading out the orders with large enough separation between orders to eliminate the possibility of ghost lines and also helps to maintain the crosstalk to a small fixed number of 1.5x10⁻⁴ (tested by 633 nm laser line).
Resolution and Bandpass
One of the biggest strengths of the Echelle design is that it can provide a high resolution and large bandpass simultaneously. The resolution in Echelle systems is defined by a CSR = Wavelength/Resolution@Wavelength
Hence a system configured as a CSR 5000 will have resolution @ 200 nm of: 5000 = 200/FWHM @ 200 nm, hence FWHM @ 200 nm = 0.04 nm.
The bandpass provided by Echelle systems is mainly dependant on the size of the Echelle grating and also the camera onto which the Echelle lines are foussed. Typically, the maximum band-width that these systems give ranges from 200 nm to 950 nm in a single shot. Depending on the design, there are other Echelle designs that provided a smaller coverage, i.e., from 522 to 1076 nm (Compact Echelle from Andor Technology designed for Raman spectroscopy) or from 200 nm to 600 nm etc. The CSRs too are available in different configurations depending on the model used, and it can vary from 2500 (low resolution) to 40000 (very high resolution).
Ruggedness
Echelle systems can be made very compact and are typically designed without any moving parts and that makes them very suitable for field based applications. These systems are known to have been deployed on-line processes to identify alloy concentrations in metal furnace hearths and have also been used in flight to capture trace element information of exhaust gas from jet engines.
Echelle Systems: Application
Echelle systems have been in use for many years for research-based spectroscopy, however, they have not been used as widely as the Czerny Turner systems. The main reason for this is that the earlier models had a very low throughput, of F/10 – F/12. However, with changes in Echelle designs, F/6 and lower are also now available. Given their ability to capture large bandpass spectral coverage of ~750 nm and simultaneously provide high resolution of 0.04 nm (at 200 nm), these systems can prove to be extremely handy and flexible tools for varied types of spectroscopy research in laboratories.
Echelle systems first found their use in Laser Induced Breakdown Spectroscopy (LIBS) applications where the formation of plasma is captured by the spectrograph and sent typically to an ICCD and the combination works well to provide elemental data of the plasma. The wide spectral coverage provides a strong advantage to the LIBS researcher as elements needed to be identified in the target sample can belong to any part of the spectrum. The strong intensity of plasmas is enough for even low throughput Echelles like those having an F/12 to successfully detect the elemental constituents of the sample.
The newer Echelle designs now available in the market provide 40-60% improvement in throughput over previously available designs, hence opening the doors for use of Echelles in a variety of applications other than LIBS, like Raman spectroscopy and Fluorescence.
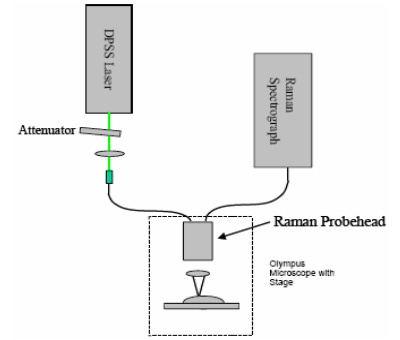
Figure 3: A schematic of the setup used for the NIR Raman experiments conducted using the Compact Echelle design from Andor Technology
Typical Applications of the Echelle have been discussed here below:
(a) Raman Spectroscopy: NIR using the Echelle spectrograph Raman experiments were conducted at the Children’s Hospital in Los Angeles with Dr. James Lambert using the 532 nm and 785 nm lines. The spectrograph used in this case is one of Andor’s newest Echelle designs called the Compact Echelle VIS-NIR. It is an F/6 instrument with a CSR of 7000, and it has a detection range from 520 to 1076 nm.
The setup used for the two laser lines is as shown in Fig. 3. For the 785 nm setup, we used a Verdi diode pumped Ti-Sapphire for excitation. Figure 4 shows a zoomed-in section of the spectra obtained with 785 nm excitation. The spectrum was collected with a 5 second exposure and fed into the spectrograph through a 100 µm VIS-NIR fibre and into a TE cooled CCD detector from Andor Technology called iDus DV420A-OE, cooled to -60°C and operating at 33 kHz readout rates.
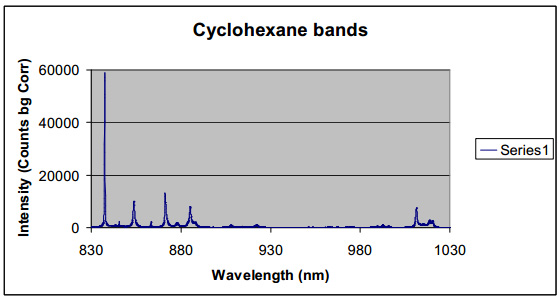
Figure 4: Zoom-in shot of the spectral window showing Cyclohexane bands as seen by the Compact Echelle
As seen from the spectrum, the cyclohexane bands in the 837-885 nm range and the 992-1020 nm group are all clearly visible.
(c) Micro-Laser Induced Breakdown Spectroscopy: UV-VIS-NIR Spectroscopy µLIBS experiments were conducted in collaboration with Dr. Robert Fedosejevs from University of Alberta and his team. The performance of the Echelle spectrometer was used to compare it with a 1/3 m focal length Czerny-Turner Spectrograph for 2D mapping of surfaces via the µLIBS technique. Simultaneous observation of the µLIBS plasma the two systems was conducted and the sensitivity of the two systems was compared.
The experimental setup is given in Fig. 5. The µLIBS plasma is observed at 45 degrees from the laser axis for both a f/3.9 Czerny-Turner spectrometer (Oriel MS260i) and an f/7 echelle spectrometer (Andor Mechelle 5000). A Ti:Sapphire laser (Spectra Physics Hurricane) produced 800 nm, 120 fs pulses with a maximum pulse energy of ~ 80 µJ on target. The laser is focused using a 15X Schwarzschild objective. An 50 µm diameter optical fibre (Ocean Optics Q50-2-UV/VIS) is used to couple the plasma emission into the Echelle spectrometer and define the entrance aperture of the echelle.
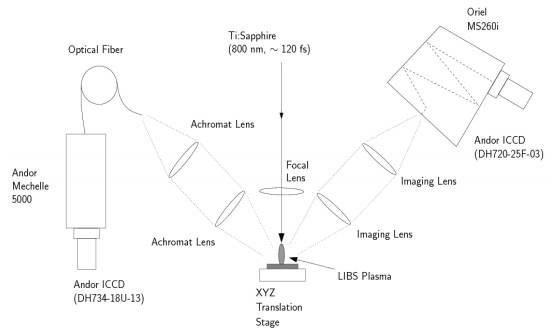
Figure 5: A schematic view of experimental setup. The plasma is observed simultaneously by both spectrometers at an angle of 45 degrees from the incident laser beam.
The Echelle was coupled with a ICCD (Andor iStar DH720-18U-13) with an enhanced response from 500 nm to 800 nm, while the Czerny-Turner was coupled with a ICCD (Andor iStar DH734-25F-03) with an enhanced response from 200 nm to 500 nm. The gate delays used ranged from 2 to 5 ns, gate width was 1 µs and both ICCDs were operated at -10 C. The ICCD on the Czerny-Turner spectrometer was used in full vertical binning mode with a pixel readout time of 16 µs, while the ICCD on the Echelle was operated in imaging mode with a pixel readout time of 1 µs.
One of the key advantages of an Echelle spectrometer is the extremely broadband spectrum that may be acquired. A sample spectrum from a 29 µJ shot on a sample of Al2024 alloy is presented in Fig. 6. The spectral width presented is limited by the achromatic imaging lenses used to image the plasma light onto the optical fibre.
The insets are regions which are relevant to the detection and identification of precipitates in aluminum alloys [8,9]. Using the Czerny-Turner spectrometer only two unresolved doublets are visible [8,9]. Following the procedure outlined in [9], the spectra were analyzed for Mg and Mn SNR. Fig. 7a gives the results of the analysis of the Czerny-Turner observations using the current setup for 4 µJ pulses on Al2024 alloy. The same analysis was performed using the spectra observed by the Mechelle for the same 4 µJ shots, but using all of the lines identified in the insets of Fig. 4. The results of this analysis is presented in Fig. 7b.
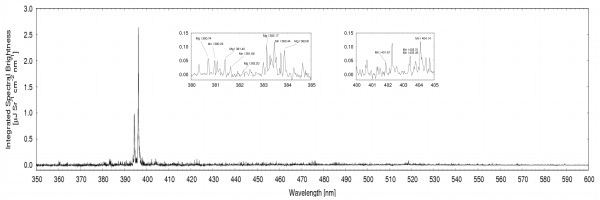
Figure 6: Mechelle spectra from Al2024 alloy, using a single 29 µJ, 800 nm pulse. Current spectral width is limited by use of achromatic imaging lenses. Insets are regions relevant to detection and identification of precipitates [8,9].
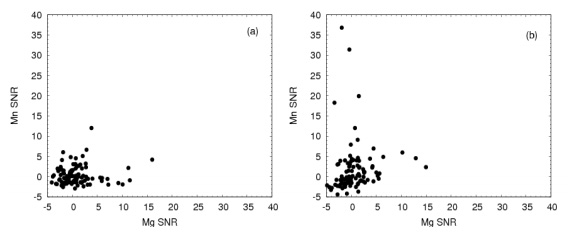
Figure 7: Correlation plot of Mg and Mn SNR from 4 µJ shots on Al2024 alloy for (a) Czerny-Turner spectrometer (2 Lines) and (b) Mechelle spectrometer (12 Lines).
The use of the multiple lines available with the Mechelle improves the detection of Mn precipitates. Combined with the detection of Mg precipitates, this result indicates that single shot 2D mapping of Al2024 surfaces would be possible at 4 µJ. Many more lines are available for simultaneous analysis with high resolution as a result of the high bandpass and high resolution provided by the Echelle design vs. the Czerny Turner design.
Future of Echelles
As has been shown from the variety applications of the Echelle design, it can be confidently said that these systems can be successfully used to perform varied types of spectroscopy techniques in laboratories. However, for these systems to become popularly accepted solutions they will need to be redesigned on several fronts:
Explore our related assets below...

© Oxford Instruments 2026
