
Resources
 Part of the Oxford Instruments Group
Expand
Collapse
Part of the Oxford Instruments Group

Application Notes
Author: Dr Ryan Mewis
Esterification is a chemical reaction involving an alcohol and a carboxylic acid (or an acid anhydride). Many esters have distinctive fruit like flavours and they naturally occur in essential oils and plants. For example, ethyl isovalerate smells of apple, ethyl butyrate smells of pineapple and ethyl nonanoate smells of grape.
In this application note, an X-Pulse spectrometer equipped with a flow cell is utilised to monitor an esterification reaction. Ethyl ethanoate (also known as ethyl acetate) will be synthesised from ethanol and ethanoic acid (acetic acid) using an acid catalyst. The reaction proceeds through a series of equilibria and this means that unless the water that is produced is removed, the reaction will not go to completion. Ethyl ethanoate is important industrially as it is used as a solvent in enamels, lacquers and nail polish removers. Furthermore, ethyl ethanoate is used in the decaffeination process of tea and coffee. A flow setup will be used to monitor the formation of ethyl ethanoate over time and at different temperatures. Using this data, the activation parameters will be calculated using an Eyring-Polanyi plot.

Scheme 1 — Esterification of ethanol and ethanoic acid catalysed by sulphuric acid to produce ethyl ethanoate and water
Ethanol (10 mL, 0.17 mol) and ethanoic acid (10 mL, 0.17 mol) were added to a two-neck round-bottomed flask equipped with reflux condenser. The second neck of the two-neck flask was used for the inlet and outlet tubes of the flow system used. The entire setup was placed in a sand bath and housed within a fumehood. The sand bath was heated to a constant temperature using a stirrer-hotplate. The reaction was initiated by the addition of five drops of H2SO4.
The flow system consisted of the reaction (as detailed in the paragraph above) attached to a peristaltic pump. The peristaltic pump was in turn connected to the bottom of the flow-cell that was housed in the X-Pulse spectrometer. The outer section of the flow cell contained D2O and this was used for a lock signal during the acquisition. The flow system was completed by connecting a tube from the top of the flow cell to the reaction vessel. For the results shown herein, a flow rate of 1 to 10 mL min-1 was used. Prior to the acquisition of any data, the instrument was shimmed on the sample matrix using the inbuilt XYZ shimming algorithm. 1D 1H NMR data was acquired using a single scan and a 90° pulse. 1H-1H COSY NMR data were collected using the acquisition parameters as noted in the text.
Prior to monitoring the esterification reaction, the flow system methodology will be optimised. Ethyl ethanoate is used as the analyte of interest for the optimisation process. Both 1D and 2D (1H-1H COSY) spectra are acquired to showcase the collection of NMR data whilst continuously flowing.
Initial tests were focused on establishing a methodology to use for the analysis of esterification reaction. For these tests, neat ethyl ethanoate was used. The 1H NMR spectrum (single scan) obtained of neat ethyl acetate in the flow cell is shown in Figure 1. A flow rate of 1 mL min-1 was used. The broad peak at ~5.2 ppm is due to the residual water signal within the D2O solvent used in the lock. The ethyl component of ethyl acetate is evidenced at 4.11 ppm and 1.26 ppm. The former is the signal arising from the CH2 and is deshielded due to being directly bonded to oxygen, whereas the latter is due to the CH3. The singlet is due to the CH3 that is isolated in ethyl acetate.
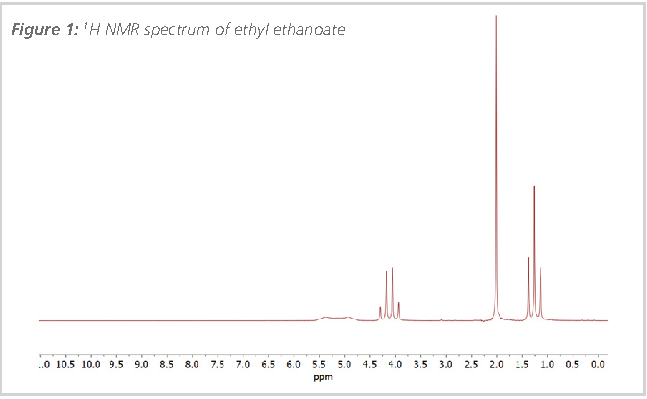
Figure 1 —
1
H NMR spectrum of ethyl ethanoate
The flow rate was then modulated from 1 mL min-1 up to 10 mL min-1. The signal intensity of the ethyl group was monitored. Figure 2A and 2B showcases the variance in the signal intensity of the CH3 and CH2 resonances of the ethyl group respectively. Although there is a general decrease in signal intensity, it does not prevent the 1H NMR spectrum of neat ethyl ethanoate from being collected in a single scan. This is shown in Figure 2C. This reduction in the signal intensity results from the reduced polarisation of the ethyl ethanoate as it passes through the magnetic field of the X-Pulse at higher flow rates.
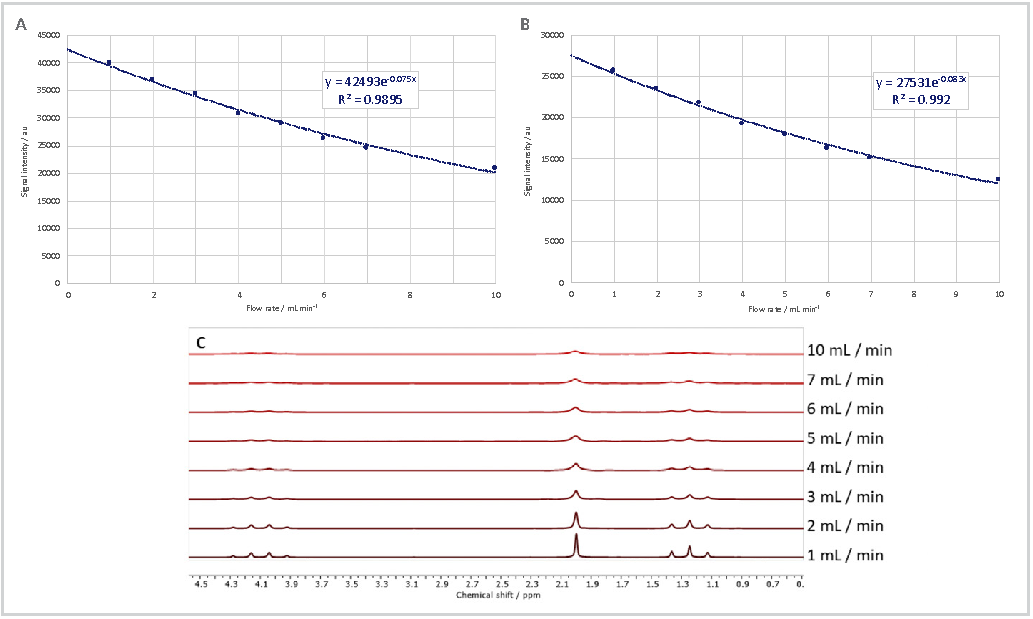
Figure 2 — A: Signal intensity as a function of flow rate for the CH3 resonance of the ethyl group of ethyl ethanoate; B: Signal intensity as a function of flow rate for the CH2 resonance of the ethyl group of ethyl ethanoate; C: 1H NMR spectra of ethyl ethanoate collected at different flow rates
1H-1H COSY data were also acquired of neat ethyl ethanoate. COSY is often used to prove the atom connectivity in a molecule in order to elucidate the molecular structure. The flow rate, as well as the number of time domain points in the f1 direction, were changed so that the 1H-1H COSY NMR spectrum could be collected in the quickest time without loss of resolution or the inability to detect cross-peaks. Figure 3 evidences the spectral appearance of the COSY spectrum collected using identical acquisition parameters but different flow rates. It is clear that even at a flow rate of 10 mL min-1, the cross peak that links the CH2 and CH3 resonances are still evident. Each spectrum took 5.5 minutes to acquire.
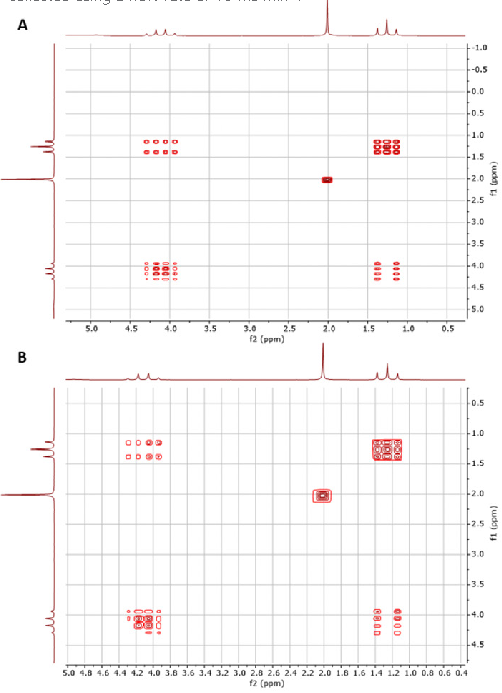
Figure 3 — 1H-1H COSY spectra of ethyl acetate. Both spectra were collected using 64 time domain points in f1 and 1024 points in f2. Each time domain point in f1 was collected using 4 scans. A 90° pulse was utilised along with a 1 s relaxation delay. Spectrum A was collected using a flow rate of 1 mL min-1 whereas spectrum B was collected using a flow rate of 10 mL min-1.
The reaction between ethanol and ethanoic acid to produce ethanoic ethanoate, catalysed by H2SO4, was first probed at 22°C. Stoichiometric amounts of ethanol and ethanoic acid were used. The catalytic amount of H2SO4 was added to the reaction mixture after the first spectra was collected; this was to ensure a stable baseline was established prior to the reaction beginning. The loss of the CH2 peak of ethanol at 3.69 ppm, and the concomitant formation of a peak at 4.11 ppm for the CH2 in ethyl ethanoate, were used to monitor the progress of the reaction. A single scan 1H NMR spectrum was collected every 2 minutes. At this temperature, the reaction proceeded slowly; the experimentally measured rate constant (k), proved to be 2.3x10⁻⁵ mol-1 dm3 s-1. Increasing the temperature to 35°C led to the reaction rate increasing; the rate constant now proved to be 5.1x10⁻⁵ mol-1 dm3 s-1. Figure 4 presents a series of 1H NMR spectra which were collected over a period of ca. 3 hours. The 1H NMR spectra highlight how the signal intensity for the two CH2 peaks change with time at 35°C.
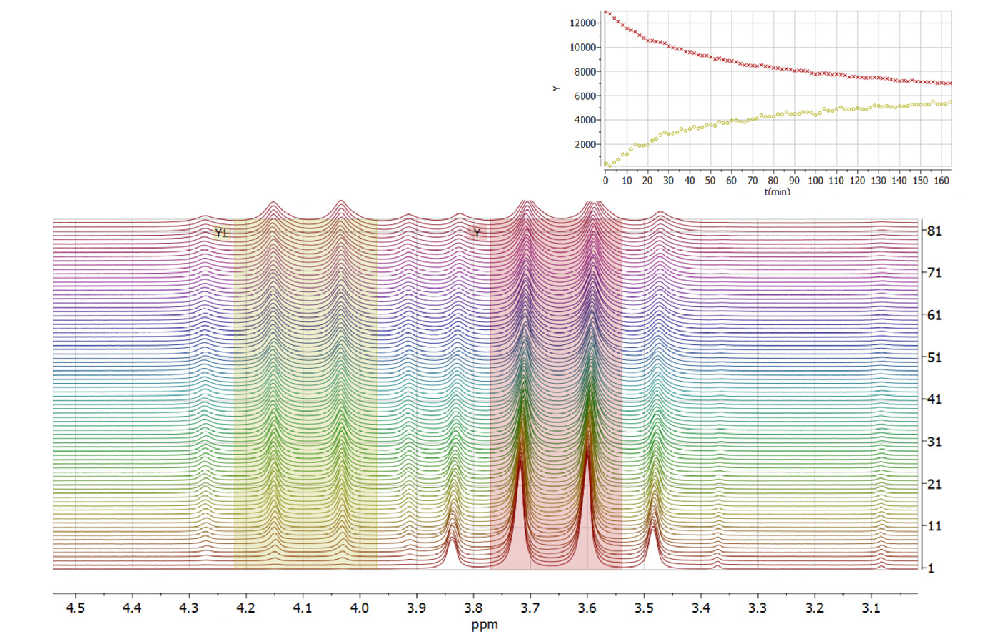
Figure 4 — Overlaid 1H NMR spectra showing the decrease in intensity of the ethanol CH2 peak (Y) and the increase of the CH2 peak of ethyl ethanoate (Y1). The graph shows the change in signal intensity over time. 1 H NMR spectra were collected 2 minutes apart.
The esterification reaction was conducted at a series of different temperatures using the same experimental procedure as utilised previously. Table 1 reports the value of the rate constant at each temperature investigated. As can be seen from the table, the value of the rate constant increases, and hence as does the rate of reaction, as the temperature increases.
| Temperature / °C | Temperature / K | Rate constant / mol-1 dm3 s-1 |
| 22 | 295 | 2.3x10⁻⁵ |
| 37 | 310 | 5.1x10⁻⁵ |
| 50 | 323 | 1.0x10⁻⁴ |
| 57 | 330 | 1.7x10⁻⁴ |
| 72 | 345 | 3.6x10⁻⁴ |
In addition to obtaining information on the kinetics of the reaction, it is also possible to use the data obtained to explore the energetics of the reaction. Specifically, it is possible to obtain values of enthalpy, ΔH, and entropy, ΔS, associated with reaching the transition state from the reactants. To obtain these values, the Eyring-Polanyi equation (Equation 1) is utilised. Using this data, ΔG can be subsequently calculated.
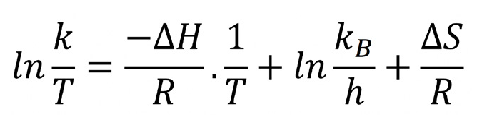
Equation 1 — Eyring-Polanyi equation. T = temperature, k = rate constant, h = Planck's constant and R = ideal gas constant.
Equation 1 is presented in the form of y = mx + c. Thus, a plot of ln(k/T) vs 1/T should give a straight line with slope −ΔH/R and intercept ln(kB/h)+(ΔS/R). The resulting Eyring-Polanyi plot is shown in Figure 5.
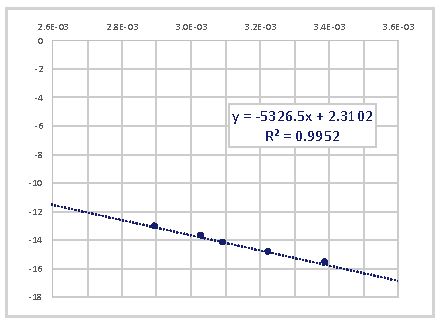
Figure 5 — Eyring-Polanyi plot for the reaction between ethanol and ethanoic acid
From the Eyring-Polanyi plot, values of ΔH and ΔS were determined to be 44.3±1.7 kJ mol-1 and −178.3±5.3 J K-1 mol-1 respectively. Thus, ΔG300K is 97.8±0.2 kJ mol-1.
The X-Pulse fitted with a flow probe enables the monitoring of chemical reactions. Initially testing focused on probing the spectral appearance of ethyl acetate at different flow rates. This facilitated a methodology to acquire 1H-1H COSY spectra of ethyl acetate in 5.5 minutes with no loss of spectral appearance when the flow rate was changed from 1 mL min-1 to 10 mL min-1. The acid-catalysed esterification of ethanol and ethanoic acid to give ethyl acetate was also monitored. Changing the temperature that the reaction was conducted at enabled the collection of experimentally determined rate constants. An Eyring-Polanyi plot gave values of ΔH and ΔS as 44.3±1.7 kJ mol-1 and −178.3±5.3 J K-1 mol-1 respectively. Using these values, ΔG300K was calculated to be 97.8±0.2 kJ mol-1.

© Oxford Instruments 2026