
Resources
 Part of the Oxford Instruments Group
Expand
Collapse
Part of the Oxford Instruments Group

Application Notes
Author: BLAGG Robin
Published: 01 Mar 2024 · Last updated: 03 Aug 2026
Polymers are large macromolecules consisting of many repeating subunits; and are synthesised by combining many small molecules, known as monomers, through a process known as polymerisation. The properties of a polymer depend on the nature of the monomer (and hence repeat unit), and the number of repeat units (chain length) and hence molecular mass.
While polymers are generally distinguished by their parent monomer / repeat unit, the chain length significantly affects the properties, and hence applications, of the polymer. Therefore, most polymers have a wide range of applications, depending on their chain length. It is therefore important to accurately know the average molecular mass (and distribution of masses) of specific batches of polymers.
In this application note, we show how the X-Pulse Broadband Benchtop NMR Spectrometer can measure the diffusion constant of a polymer, and how this can be used to calculate the polymer chain length.
Polyethylene glycol (Figure 1) is a polymer of ethylene oxide and is commercially available over a wide range of molecular weights, between 300 g.mol−1 (n ≈ 6) and 10×106 g.mol−1 (n ≈ 227×103).
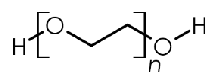
Fig. 1 — Polyethylene Glycol (PEG)
PEGs are liquids or low melting point solids, and have a wide range of applications, including as an additive in many cosmetics and pharmaceuticals; as a preservative for historic materials; in food and drinks; and in many household products. The different applications of PEG require different polymer chain lengths (and hence molecular mass), therefore it is important to be able to determine the average molecular mass of PEG (and many other polymers).
There are a range of approaches for measuring polymer chain length, and one of the most useful is using nuclear magnetic resonance (NMR) to measure the diffusion constant of the polymer. The diffusion constant (D) of a molecule in solution represents how rapidly it moves through the solution; since larger molecules will diffuse more slowly, it is possible to correlate diffusion constants to polymer chain length.
Measurement of diffusion constants by NMR spectroscopy can be performed by a range of methods. In this case the Pulsed Field Gradient Spin-Echo (PGSE) pulse sequence (Figure 2) is used. In the PGSE sequence two pulsed field gradients, of duration δ, are interleaved with a spin-echo, with diffusion taking place in the time between the two gradients (Δ). As the strength of the gradients is increased, the observed signal is attenuated; from the effect of the gradients on the observed NMR signal(s) the diffusion constant can be calculated, as shown later.
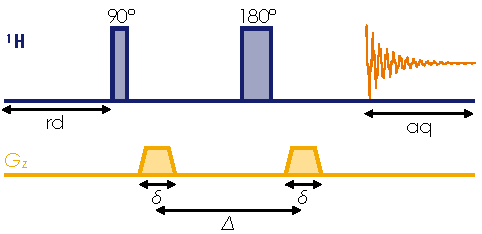
Fig. 2 — Pulsed Field Gradient Spin-Echo (PGSE) pulse sequence
For this study, six low polydispersity (a narrow distribution of molecular masses) PEG samples were investigated, with average molecular masses between 1010 g.mol−1 (n ≈ 22) and 21300 g.mol−1 (n ≈ 484). All of these were solids at room temperature, and for analysis were prepared as dilute (ca 50 mg.mℓ−1) solutions in D2O.
For each sample an identical series of 1H PGSE NMR spectra were obtained, with the gradient strength varying between 0.00 and 0.45 T.m−1, gradient lengths (δ) of 4.5 ms, and a diffusion time (Δ) of 22.5 ms. Acquiring the data under qNMR conditions, the spectra for each sample was obtained in around 3½ hours.
The resulting 1H PGSE spectra of the six PEG samples are shown in Figure 3. These spectra clearly show that as the gradient strength is increased, the degree of signal attenuation also increases. However, the amount of signal attenuation is reduced as the PEG molecular mass increases (indicating slower diffusion).
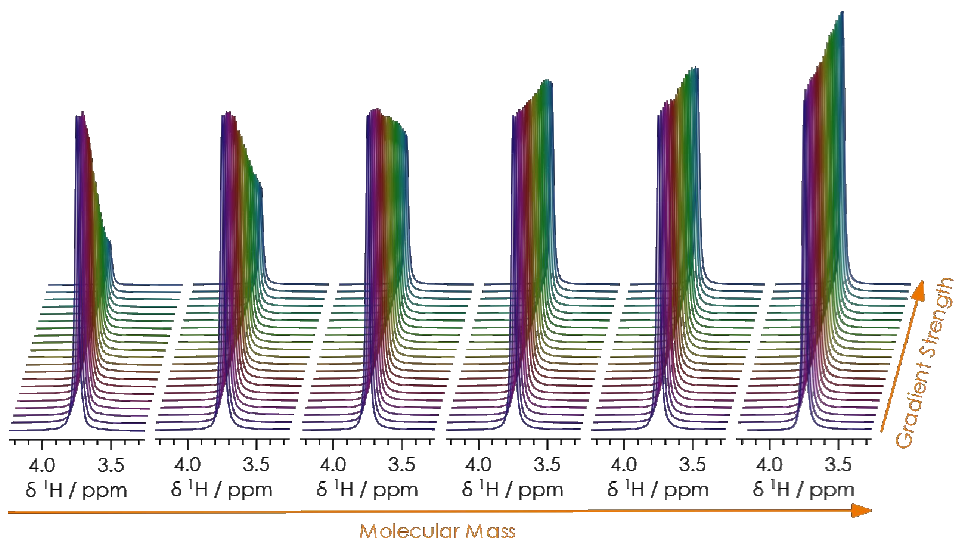
Fig. 3 — 1H PGSE spectra, for dilute Polyethylene Glycols in water at +40°C
The diffusion constant is calculated from the PGSE spectra using the Stejskal-Tanner equation, one form of which is shown below:
ln(I / I
0) = −{γ2δ2(Δ − δ/3)G2}D
By plotting: the natural logarithm of the ratio of the signal intensity at a given gradient strength (I), to the signal intensity when no gradient is applied (I
0); against {γ2δ2(Δ − δ/3)G2}, where γ, δ & Δ are constants, and G is the applied gradient; it is possible to calculate the diffusion constant (D) from the gradient.
The resulting Stejskal-Tanner plots are shown in Figure 4 for all six PEG samples. All six samples give a straight-line plot, indicative of a single diffusion process (low polydispersity).
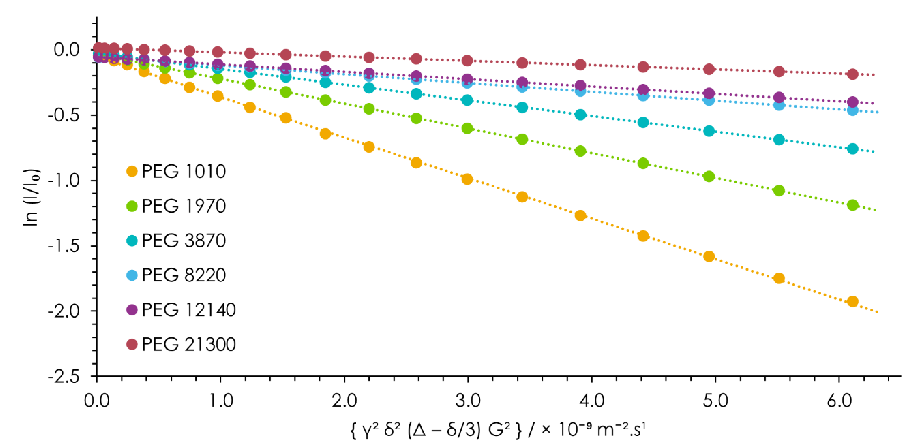
Fig. 4 — Stejskal-Tanner plots for dilute Polyethylene Glycols in water at +40°C
Diffusion constants can be correlated to molecular masses (polymer chain length) by plotting log10(diffusion constant) versus log10(molecular mass), which gives a linear calibration curve (Figure 5).
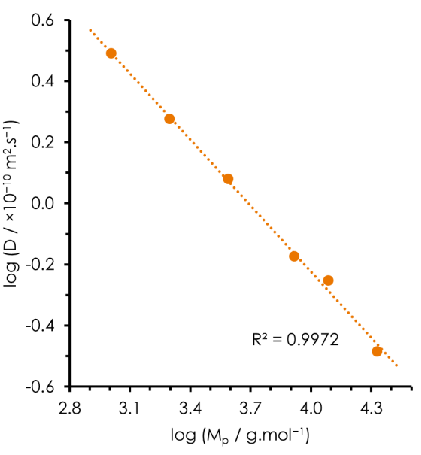
Once the calibration curve has been constructed, molecular masses of unknown samples of PEG can be calculated by measuring their diffusion constant by 1H NMR.
In this application note we have shown how polymer chain lengths can be calculated from the diffusion constant of the polymer, as measured by NMR spectroscopy.
The X-Pulse Broadband Benchtop NMR Spectrometer comes with three-axis pulsed-field gradients as standard, with a maximum gradient strength of ≥0.5 T.m−1 (≥50 G.cm−1). The X-Pulse can also be configured for variable temperature operation, allowing measurements to be performed over a sample temperature range of 0 to +65°C, which can be useful since diffusion constants vary with temperature.

© Oxford Instruments 2026