
Resources
 Part of the Oxford Instruments Group
Expand
Collapse
Part of the Oxford Instruments Group

Application Notes
Author: Oxford Instruments
Published: 02 May 2019 · Last updated: 02 May 2019
Automated SEM based particle and feature analysis has been used for specific tasks such as gunshot residue analysis and technical cleanliness analysis for many years. The combination of morphological and chemical data on a particle by particle basis enables the deepest understanding of the nature of particulated samples with respect to the origin of particles and their role in the processes being studied. AZtecFeature is a new SEM software solution for particle analysis that offers increased speed, a significantly enhanced user experience and the highest possible accuracy. Here we consider AZtecFeature in the context of engine wear monitoring, geology and air cleanliness and pollution. We discuss how key improvements in AZtecFeature in combination with recent advances in EDS detector hardware make it a compelling proposition for a much wider group of researchers and practitioners in industry and academia.
The particle analysis process is essentially as follows: An electron image of a single field of view is recorded and particles are identified from the background by means of grey level thresholds. In some cases a single threshold is used for all particles, in others multiple thresholds are utilised to distinguish particles of different types. Morphological and chemical data is then recorded from each particle. The particles are then automatically grouped using the chemical and morphological information by applying so called "classification schemes".
AZtecFeature brings many advances to particle analysis in the SEM and is fully integrated with Oxford Instruments' leading AZtec® microanalysis suite. It is designed to take advantage of the raw speed and accuracy of X-MaxN silicon drift detectors and the ease of use and performance of AZtec. By combining the advantages of large area SDDs, 64bit processing and AZtec's Tru-Q® quantification, AZtecFeature is able to obtain particle information at very high accuracy very quickly via a guided workflow for absolute ease of use.
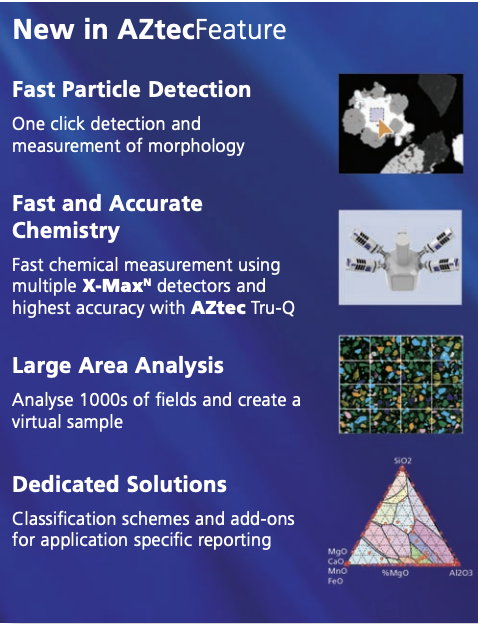
AZtecFeature uses a guided workflow to take both the novice and expert user through the process of particle analysis. Ease of use is central to AZtecFeature and particle information is obtained within just a few clicks of entering the interface. Feedback is given in real time as particle morphology is measured instantly as grey level thresholds are defined, making optimisation quick and simple. An assisted classification procedure further enhances ease of use by using the data from user selected particle(s) to create classes. Instant feedback is also given during this process – the classification of the dataset and particle image are both updated as changes are made.
Data acquisition and processing makes AZtecFeature truly powerful. Up to four X-MaxN SDD devices with a total possible detection area of 600 mm² can be used to collect X-rays at exceedingly high count rates permitting very short acquisition times and maximum throughput during automated large area runs analysing many thousands of particles. Each spectrum obtained from each individual particle is subjected to AZtec's rigorous data processing. The Tru-Q algorithm corrects for pulse pile up and background effects and performs peak overlap deconvolution. This is essential to ensure that accurately quantified data is obtained from each particle. These advances are demonstrated in the following three case studies.
Geological samples can be some of the most complex particulated samples to analyse owing to the fact that each particle may contain many grains, each of a different mineral phase. In order to perform an effective analysis of such samples it is therefore important that grey level thresholds are set up carefully such that individual grains of different composition can be separated from one another.
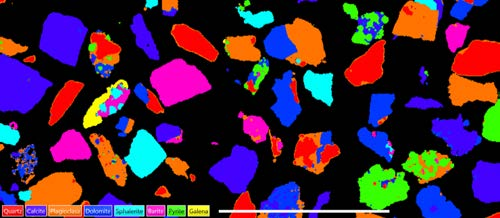
Fig. 1. AutoPhaseMap showing complex mineral grains. White line indicates 250um.
In order to set up the grey level thresholds, a BSE image was first scanned into AZtecFeature. Five separate grey level ranges which covered all visible grains were then chosen using the interactive thresholding tool. This one-click tool enables users to click on a feature with a certain grey level range and define a threshold with that range.
Live ED data was acquired from each of the identified grains on the same field of view that was used for thresholding. A large area X-MaxN SDD detector was used to obtain the X-ray data with an acquisition time of 0.1s per grain. Having acquired particle data, the next step was to create a scheme to classify the particles into their various types. In AZtecFeature classifications can be created in an assisted way. The user can select particles which should be classified together and the rules of the classification scheme are automatically created based on that selection. This means that it is possible to classify a sample very quickly as immediate feedback is given as updated classifications are displayed as soon as they are created.
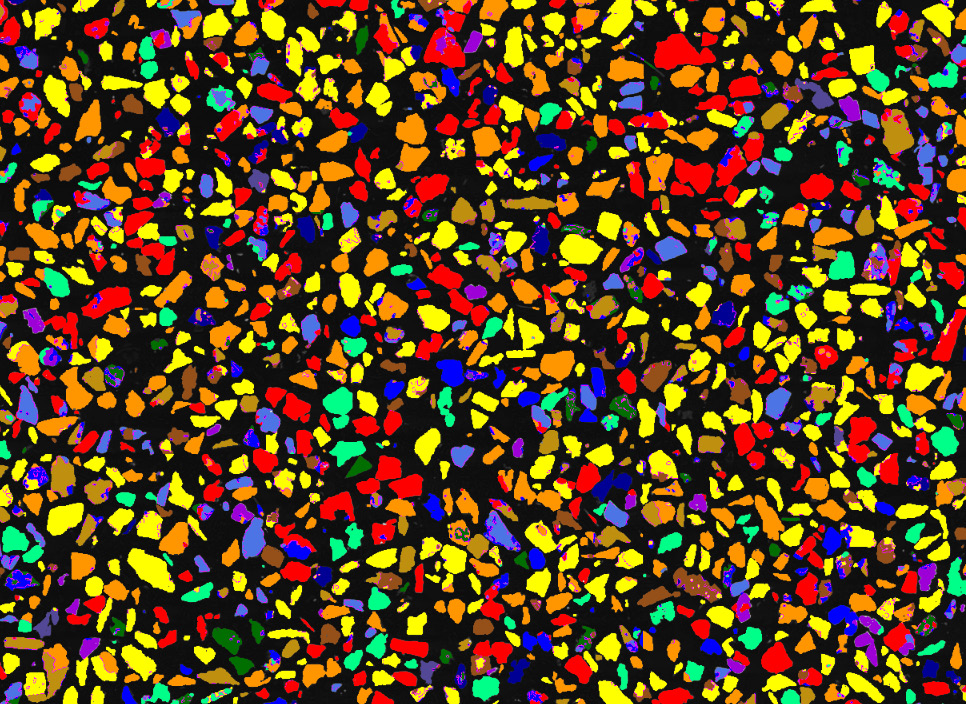
With the classification scheme built, the next step was to perform a large area run across the sample to obtain data from many more particles and grains. These particles were classified with the scheme which had been created from the first field of view in real time with totals for each class updated as the run progressed. At certain points during the run, phases were found which were not present in the field of view which was used for set up as they were rare. In such a case it is possible to pause the run, amend the classification scheme and then continue. All data acquired up to that point was immediately re-classified with the new scheme to ensure consistency with new data. A classification colour coded montaged image was also generated in real-time enabling the phase distribution in the sample to be intuitively understood. Summary data for element content was automatically calculated. The bulk composition is shown in Table 1.
| Element | Wt% |
| O | 42.48 |
| Si | 12.68 |
| S | 11.61 |
| Zn | 10.62 |
| Ca | 10.41 |
| Fe | 3.06 |
| Ba | 3.03 |
| Pb | 1.60 |
| Al | 1.46 |
| Mg | 1.23 |
| K | 0.91 |
| Na | 0.38 |
Table 1. Bulk elemental content calculated from particle data.
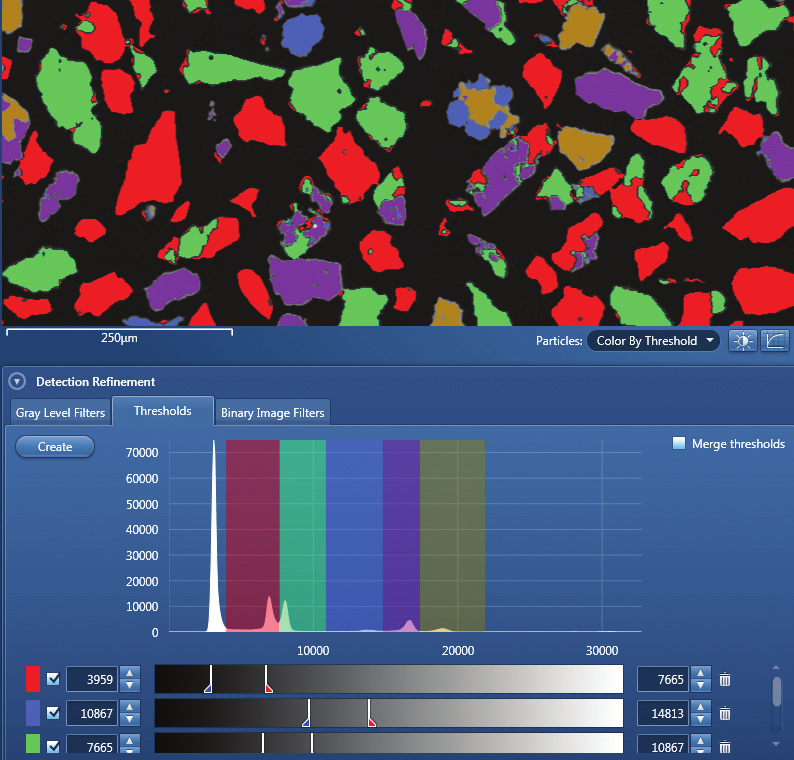
Fig. 2. Multiple grey level thresholds set up to cover all phases in a mineral sample.
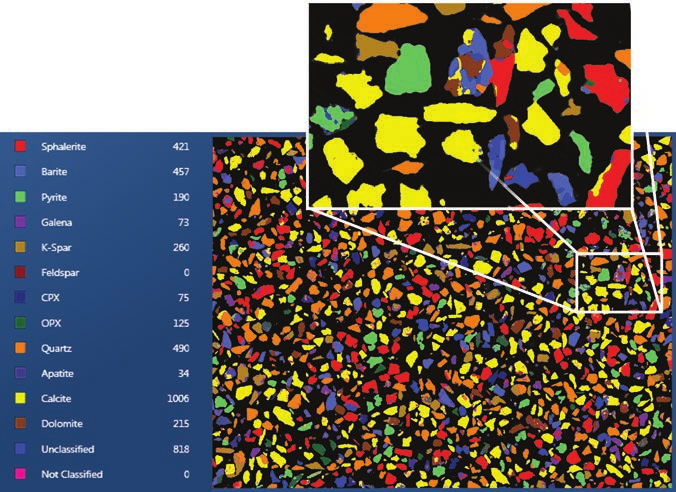
Fig. 3. Classified feature image showing complex intra-particle phase relationships.
This sample is made up of various wear particles of varying morphology and composition on a carbon stub such as are found from the wear of automotive or aerospace engines or gearings in other industrial settings.
As detectors become faster, mapping is more commonly used for the initial, exploratory, manual analysis of a sample. With AZtecFeature we can for the first time create a virtual sample by storing and processing large area X-ray maps. Here, we show how to extract particle information from a previously acquired mapping dataset on an offline system; collecting morphological and chemical information for all particles across the sample without the need for any additional live acquisition.
During the original map acquisition, backscattered electron (BSE) images were acquired from each field of view. When the acquisition of the large area map was complete, it was montaged to create a single dataset for the entire large area.
As the large area map contains all the image and X-ray data at every pixel, particle analysis can be carried out retrospectively, without having to put the sample back into the microscope. Particles were identified and separated from the dark background of the carbon stub by means of a single grey level threshold. This was defined via a single click and could be edited interactively if desired. The morphology of all particles falling within this threshold was measured automatically and instantly during the setup process. Chemical data was then quickly obtained for each particle using an automated extraction process which was also triggered by a single click. The morphological and chemical data associated with each individual particle was stored in a database which could then be interrogated.
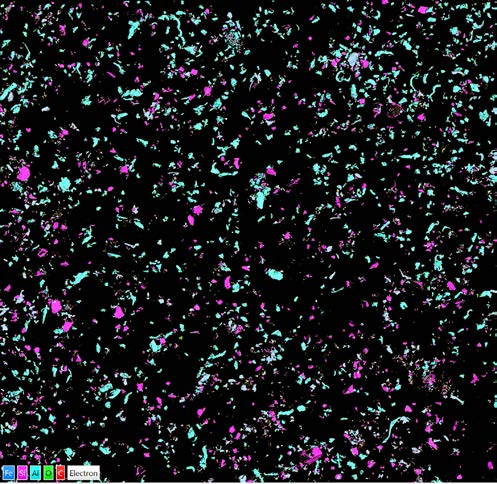
Fig. 4. Large Area Montaged Map created from 12 Fields from which particle data was extracted.
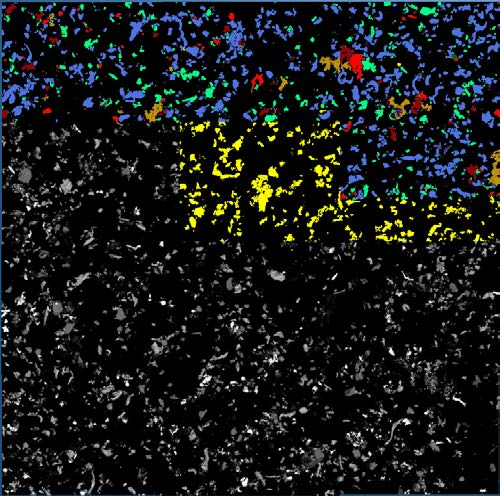
Fig. 5. Real time classification of particles during extraction of data from a large area map
A classification scheme developed using the assisted method described above classified the data live, during extraction. (Fig. 5.) Relative abundances of the different particle types were determined (Fig. 6) along with a selection of morphological measures - aspect ratio is shown (Fig. 7).
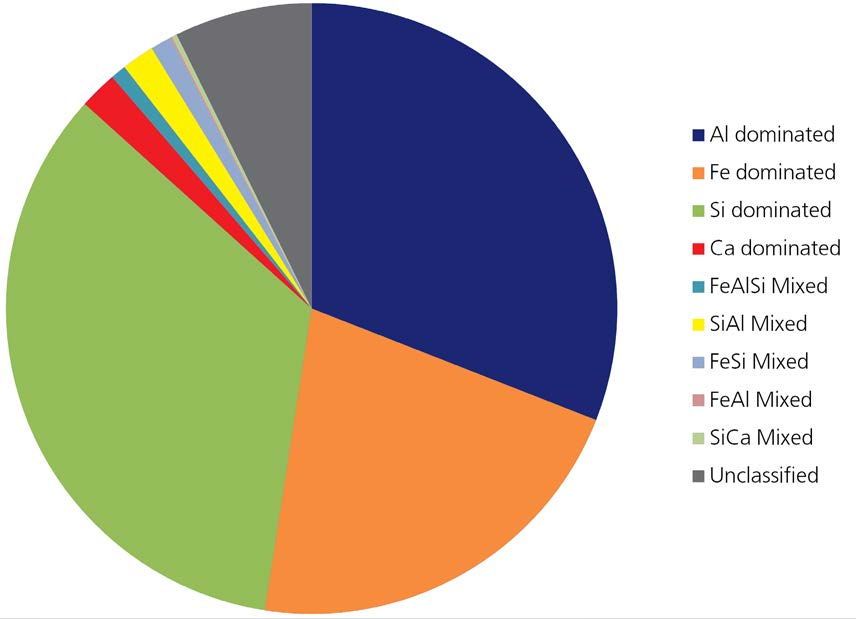
Fig. 6. Pie chart showing classified particle type by area.
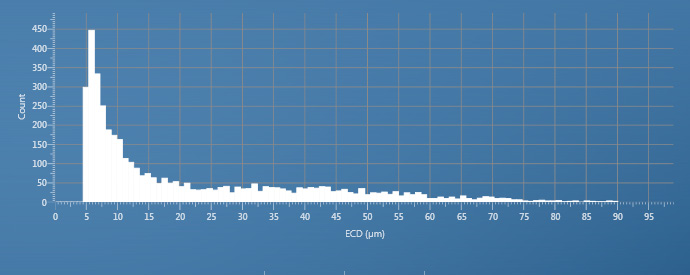
Fig. 7. Histogram generated by AZtecFeature showing Aspect Ratio for all particles.
Airborne particles have the potential to be hazardous for human health if they escape into the wider atmosphere as pollutants. The ingestion of heavy metal particles, particularly of very small sizes is especially dangerous. Consequently, an understanding of the chemistry and morphology of particles collected on air filters is essential. The particles in this sample were primarily metallic in composition and sat upon a polycarbonate filter which was particularly sensitive to beam damage. The particles also ranged in size between approximately 300 nm and agglomerations of multiple particles amounting to several μm. The smaller minimum particle size meant that a lower accelerating voltage needed to be used so that the interaction volume of the electron beam with the sample was reduced with two significant effects:
This reduction in accelerating voltage, when combined with a reduction in beam current, also reduced beam damage to the polycarbonate filter substrate.
The large range in particle size caused a problem where some small particles which were close to large agglomerations did not have EDS data as they were being shadowed. To overcome this a system with multiple X-MaxN detectors was used. By obtaining EDS data from multiple detectors, each looking at the sample from a different angle, the shadowing issue was resolved as the area cast into shadow from the point of view of one detector was in full view of the other. There was also a significant improvement in the speed of analysis: As lower accelerating voltage and beam currents had been used to minimise sample damage, X-ray counts had been reduced. By using multiple detectors it became possible to collect a significantly greater number of X-rays at the same low kV and beam current conditions, so analyses could be completed more quickly. This led to even less beam damage to the sample as it was exposed for less time.
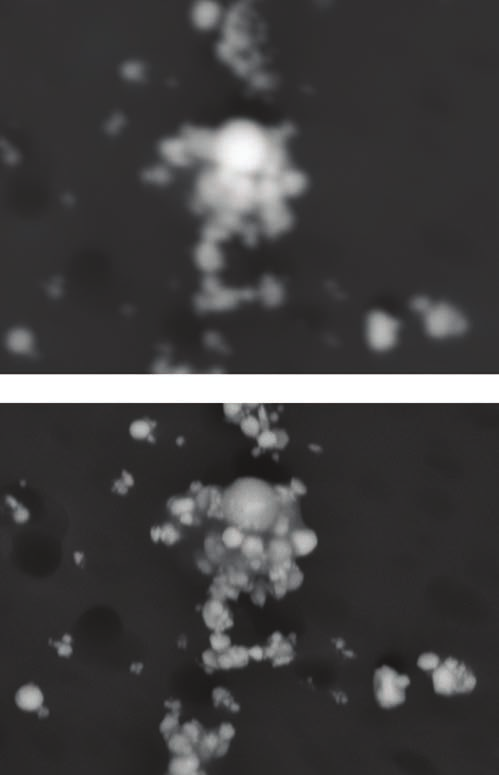
Fig. 8. Backscattered electron images of small particles on an air filter acquired at 20 kV (top) and 10 kV (bottom). Better image resolution (clearer, less blurry image) is achieved at 10 kV. enabling more accurate measurement of particle morphology
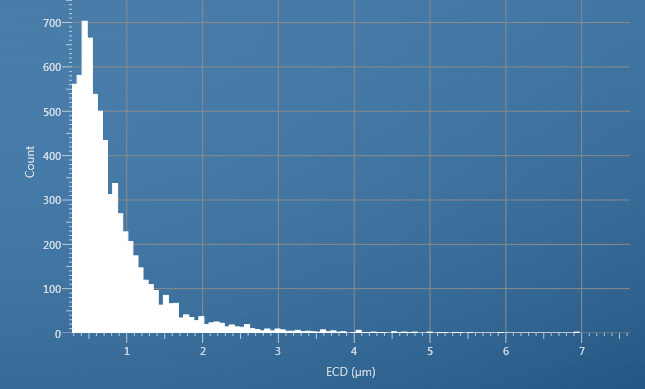
Fig. 9. Equivalent Circular Diameter histogram of air filter particles.
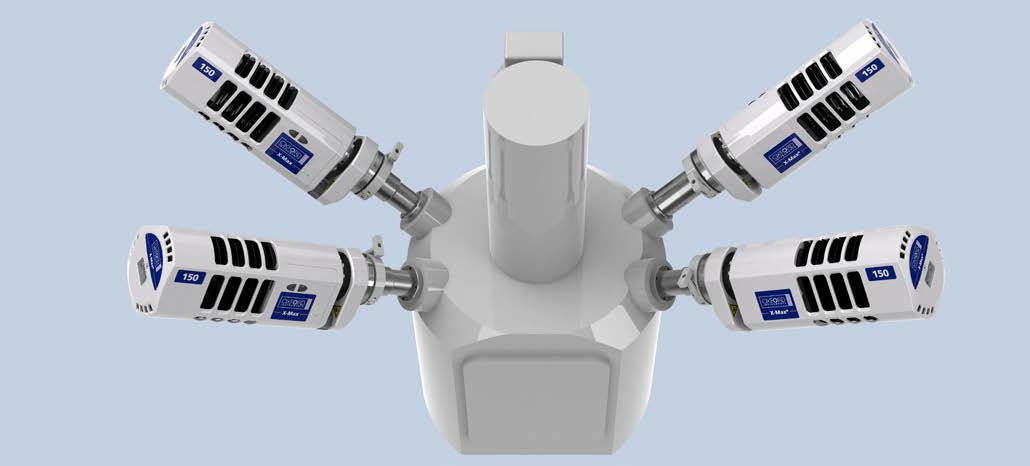
Fig. 10. Up to four X-MaxN detectors can be used on a column to increase throughput and to reduce the effect of shadowing (see below).
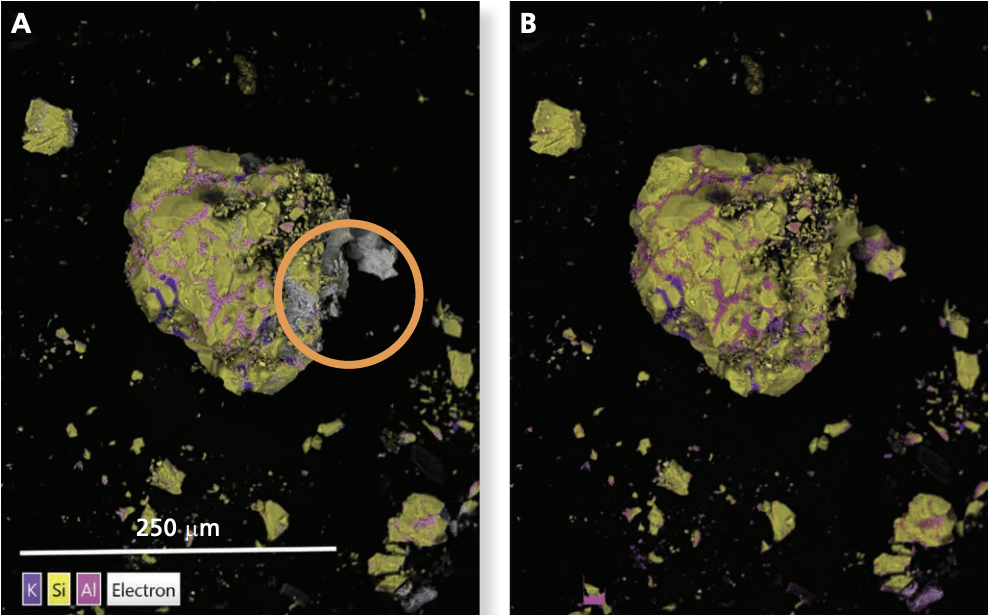
Fig. 11. A.) Image of a debris sample using a single detector positioned at the left - a shadowing issue is highlighted. B.) Using two detectors on both sides fixed the problem, and gave better, richer data in the same time - even in the areas that were not subject to shadowing.
AZtecFeature is a flexible particle analysis tool which makes particle analysis a straightforward operation, even for non-experts. By taking advantage of up to four X-MaxN SDDs and 64 bit computing power it is able to obtain chemical data and process it exceedingly quickly making the analysis of large areas with many thousands of particles efficient. Tru-Q algorithms ensure that data quality is maintained, even at the highest count rates. Assisted grey level threshold and classification setup makes these two, potentially more complex steps simple. Instant feedback during these two steps enables the user to see the effects of their changes therefore reaching an optimised setup or classification much more quickly and easily.

© Oxford Instruments 2026