
Resources
 Part of the Oxford Instruments Group
Expand
Collapse
Part of the Oxford Instruments Group

Application Notes
Published: 01 Nov 2024 · Last updated: 03 Aug 2026
The Raman effect is based on the inelastic scattering of light by the molecules of gaseous, liquid or solid materials. The interaction of a molecule with photons causes vibrations of its chemical bonds, leading to specific energy shifts in the scattered light. Thus, any given chemical compound produces a particular Raman spectrum when excited and can be easily identified by this individual "fingerprint."
Raman spectroscopy is a well-established, label-free and non-destructive method for analyzing the molecular composition of a sample.
In Raman imaging, a confocal microscope is combined with a spectrometer and a Raman spectrum is recorded at every image pixel. The resulting Raman image visualizes the distribution of the sample's compounds. Due to the high confocality of WITec Raman systems, volume scans and 3D images can also be generated.
The Raman effect is extremely weak, so every Raman photon is important for imaging. Therefore WITec Raman imaging systems combine an exceptionally sensitive confocal microscope with an ultra-high throughput spectrometer (UHTS). Precise adjustment of all optical and mechanical elements guarantees the highest resolution, outstanding speed and extraordinary sensitivity — simultaneously!
This optimization allows the detection of Raman signals of even weak Raman scatterers and extremely low material concentrations or volumes with the lowest excitation energy levels. This is an unrivaled advantage of WITec systems.
Lateral resolution is physically limited to ~200 nm, depending on the wavelength of the incident light.
The more sensitive a system is, the shorter the acquisition time for a single spectrum. WITec's Ultrafast Raman Imaging reduces acquisition times for single Raman spectra down to well below 1 ms.
A high confocality increases the signal-to-noise ratio by reducing the background. With the UHTS Series, WITec developed lens-based, wavelength-optimized spectrometers with a spectral resolution down to 0.1 cm-1 relative wavenumbers.
Properties of food such as flavor and texture critically depend on the distribution and microstructure of its various ingredients, including additives such as emulsifiers, stabilizers and thickeners. The food industry therefore requires powerful analytical tools for optimizing products and ensuring their compliance with quality standards. Raman microscopy is ideally suited for this task, as it can characterize the chemical composition of heterogeneous samples on the sub-micrometer scale [1–6] and analyze particles, for example in beverages [7].
Highly sensitive confocal microscopes enable fast and high-resolution Raman imaging simultaneously. A Raman image of banana pulp consisting of more than one million Raman spectra was acquired in less than 45 minutes (Fig. 1). It visualizes the distribution of starch grains and carotenoids in a water matrix.
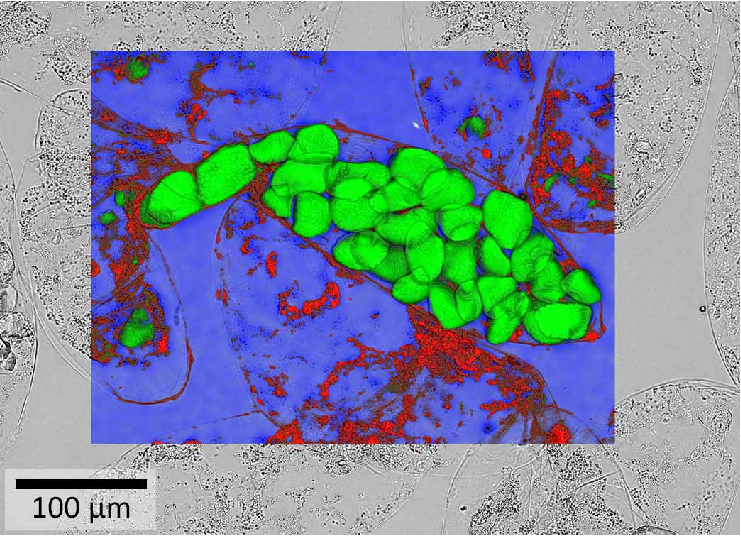
Fig. 1 — Raman image of squashed banana pulp overlaid on a white-light image. The main components are starch (green), carotenoids (red) and water (blue). Image parameters: 400 x 300 μm², 1200 x 900 pixels, integration time: 2 ms per spectrum.
Confocal Raman imaging can also visualize the distribution of compounds in 3D and characterize crystal properties. A 3D Raman image of a honey droplet was generated from 50 individual 2D Raman images acquired at successive planes along the z-axis (Fig. 2). It shows a pollen grain embedded in the liquid honey phase. Three different crystalline honey phases are also differentiated.
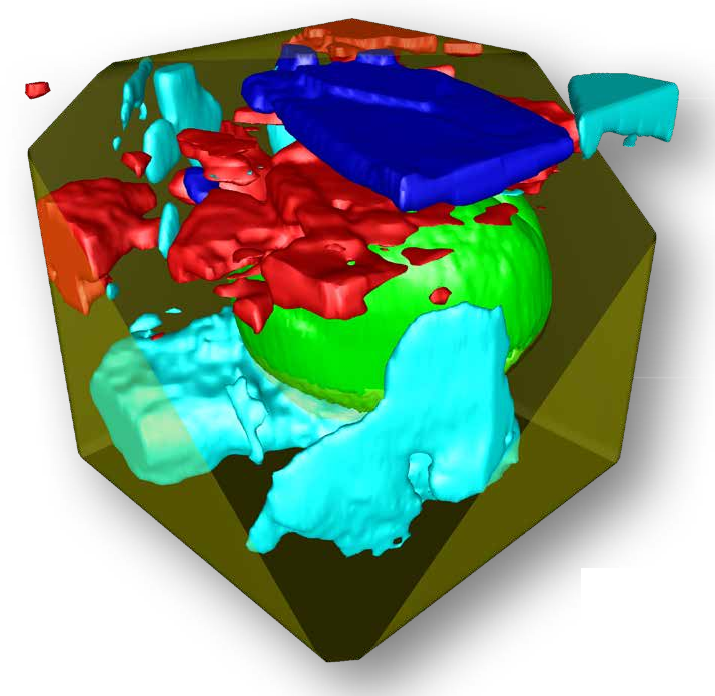
Fig. 2 — 3D Raman image of a honey droplet. The liquid honey phase (yellow) surrounds a pollen grain (green) and several crystalline honey phases (red, blue, cyan). Image parameters: 50 x 50 x 50 μm³; 150 x 150 x 50 pixels; 2 ms per spectrum.
Fat-spreads such as butter or margarine are water-in-oil emulsions. The microstructure of fat-spreads determines properties such as suppleness, texture, stability and spreadability. These properties depend on the fat crystal network at the water/oil interface and on the emulsifier and they are strongly influenced by the production process. Therefore, manufacturers of emulsions and fat-spreads analyze their products in detail to understand the relationships between their composition, production process, structure and function. For this purpose, confocal Raman imaging is a very valuable technique [1].
The following example presents a confocal Raman image of an emulsion containing fat, water and the emulsifier E476 polyglycerol polyricinoleate (PGPR). This emulsifier decreases the friction between solid particles, for example, in chocolate. A Raman image of the emulsion shows the distribution of its ingredients (Fig. 3). The emulsifier PGPR clearly accumulates at the interface between the water droplets and the fatty matrix.
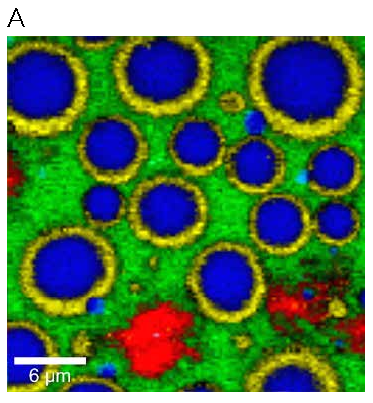
Fig. 3 — Confocal Raman study of a food emulsion. (A) Raman image of the emulsion, color-coded according to the spectra in (B): emulsifier PGPR (yellow), water (blue) and fatty matrix (red, green). (B) Raman spectra of the emulsion's components.
A study from the Dutch company Unilever describes hyperspectral data analysis of Raman images of fat spreads including data-pre-processing and multivariate curve resolution (MCR) [1]. Confocal Raman imaging could not only locate the molecular compounds in fat spreads, but also relate their microstructure and production processes. The results show that water forms droplets in a continuum of sunflower oil, stabilized at the interface by an emulsifier (monoglycerides) and lipids in the crystalline phase (Fig. 4). The crystalline lipids (solid fat) are also found in the continuous phase of the emulsion, forming a network between the different water droplets. The rightmost image shows the competition/co-crystallization between the solid fat and the emulsifier at the droplet interface. The authors of the study conclude that, "This method can be applied to a wide range of different food emulsions such as butter, margarine, mayonnaise and salad dressings." [1]

Fig. 4 — Raman images of a fat-spread. From left to right, the concentrations of sunflower oil, water, solid fat and emulsifier are shown in individual images, with the highest concentrations in red and the lowest in dark blue. In the rightmost image, the Raman signals from solid fat and emulsifier are overlaid. Image parameters: 20 x 20 μm², 86 x 86 pixels. Images courtesy of Gerard van Dalen and colleagues, Unilever, Vlaardingen, The Netherlands.
In a related example, Raman imaging is used to compare two butter products in order to investigate the chemical differences underlying their different spreadability. Individual 3D Raman images of normal butter and a more spreadable product were generated by combining 2D images acquired at successive focal planes along the z-axis (Fig. 5A, B). Both products clearly are water-in-oil emulsions as expected. The water content is higher in the spreadable butter and the water forms larger droplets than in the more solid fat-spread. Chemical differences in the fatty phases become evident by comparing their Raman spectra (Fig. 5C). Each product is shown to contain different types of fat and oil. The consistency of fats is influenced by the amount of unsaturated fatty acids, among other parameters. The unsaturation level of fats can be compared by the ratio of the C=C stretching mode around 1655 cm-1 (relative wavenumbers) and the CH2 scissoring mode around 1444 cm-1 [8], which is higher for the spreadable butter than for the normal one (Fig. 5C). This indicates a higher amount of unsaturated fatty acids, which contributes to the improved spreadability.
Fat-spreads with a high amount of unsaturated amino acids and a reduced fat content are also considered healthier than conventional butter.
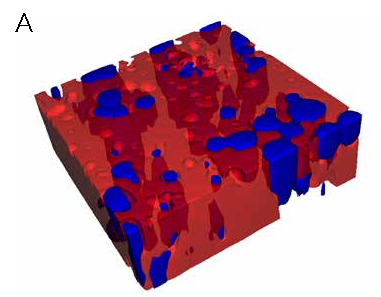
Fig. 5 — Comparison of two butter products. (A+B) 3D Raman imaging of conventional (A) and spreadable butter (B). Blue: water phase; red, green: fat phases. (C) Raman spectra of the fatty phases (red: normal butter, green: spreadable butter) and zoom-in.
A Raman image of white chocolate clearly reveals a distinct phase separation, with sucrose and additive particles embedded in a fatty matrix (Fig. 6). The sizes of the sucrose particles vary between 0.65 µm and 10 μm.
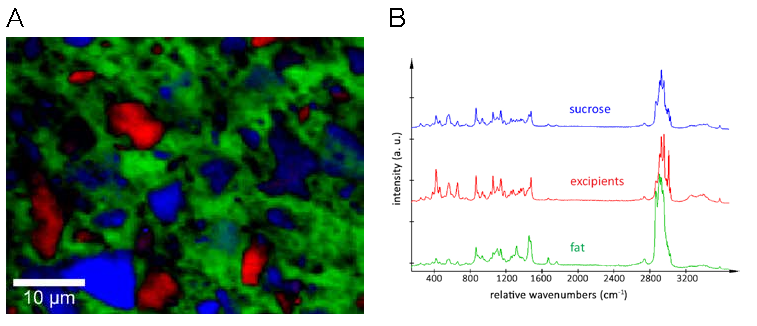
Fig. 6 — Raman imaging of white chocolate. (A) Raman image of white chocolate, color-coded according to the spectra in (B): sucrose (blue), fat (green) and excipients (red). (B) Raman spectra of the chocolate's ingredients.
WITec's TrueSurface™ technology enables topographic Raman imaging, a correlative technique that records a Raman image and the surface topography simultaneously and compensates for height differences during the measurement. Thus, Raman spectra are acquired from precisely along the surface, or at a set, user-defined distance above or below it. Roughly textured, inclined or irregularly-shaped samples are reliably kept in focus during Raman measurements, even for large-area scans and during long measurements. The resulting topographic Raman image correlates the distribution of a sample's chemical compounds with its structural features.
TrueSurface's capabilities are demonstrated on a sugar bar in the following application. Seven components were identified by their Raman spectra and their distribution is visualized on a very large, rough surface and even along the imprinted text (Fig. 7).
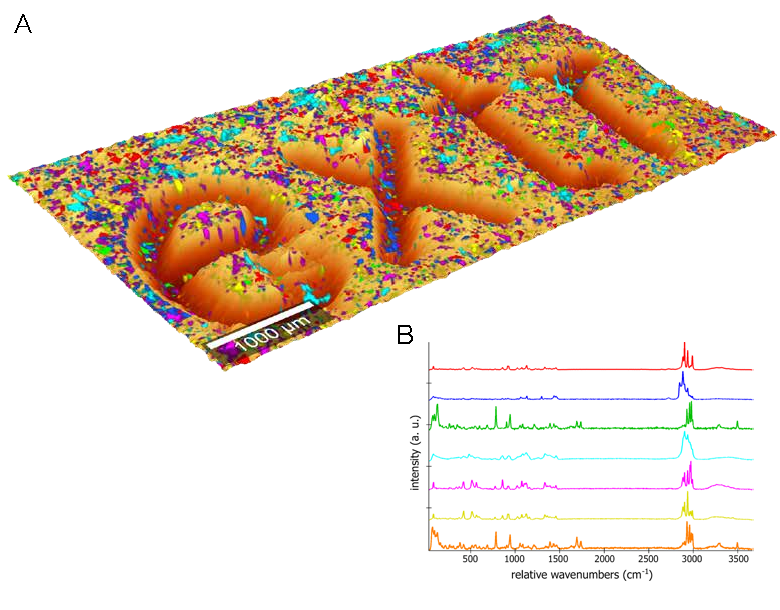
Fig. 7 — Topographic Raman Imaging of a sugar bar. (A) The topographic Raman image displays the distribution of seven chemical components (B) on the rough surface of a sugar bar, even along the imprinted text. (B) Raman spectra of the seven components.
The second example investigates the frosting on a gingerbread cookie. The distribution of the frosting's components on the cookie's uneven surface is visualized in a topographic Raman image (Fig. 8A). As expected, the frosting consists of different sugars and polysaccharides (Fig. 8B).
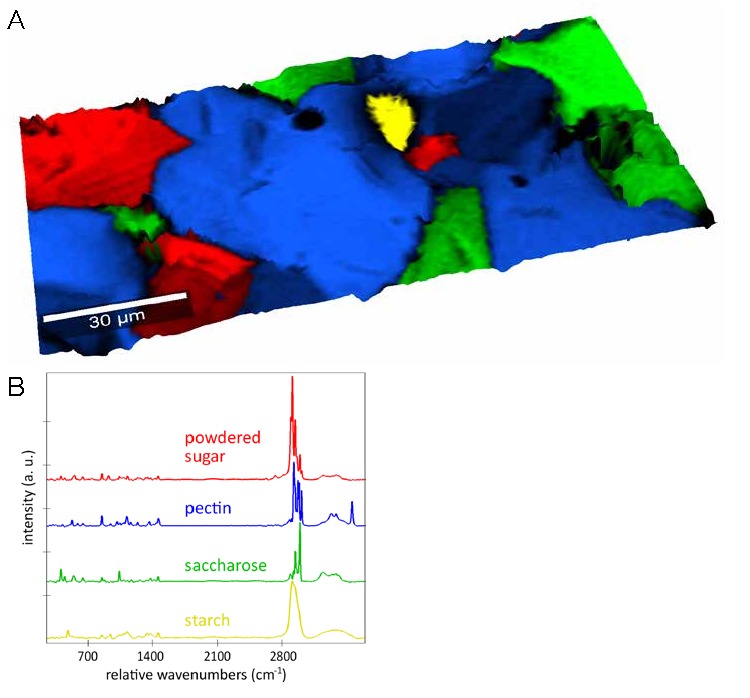
Fig. 8 — Topographic Raman imaging of frosted gingerbread. (A) Raman image overlaid on the surface topography. The frosting consisted of different sugars (red and green) and polysaccharides (blue and yellow). (B) Raman spectra of the frosting's components.
Many ingredients for baking and cooking are particulate, for example flour, sugar, salt, baking powder, semolina, starch and many spices, and their size and distribution influence the macroscopic properties of food products. In drinks such as beer, the analysis of haze particles is an important task [7]. Comprehensive particle analyses are thus relevant for research, development and quality control in the food and drink industries. Apart from characterizing particulate products, the detection of microplastic particles is important as microplastics are becoming increasingly prevalent and their potentially harmful effects on humans and animals continue to be investigated [9].
Here we demonstrate particle analysis with Raman spectroscopy using an alpha300 Raman microscope equipped with WITec's particle analysis software, ParticleScout. For this purpose, a mixture of typical particulate baking ingredients was spread on a cover slide and white-light images were acquired at different sample positions. The dark-field image of one area is shown in Fig. 9A. Raman spectra were recorded automatically for the particles in all images and identified using the TrueMatch integrated database management software. Fig. 9B shows the same sample area as Fig. 9A, but with the analyzed particles color-coded according to their chemical identities. As the different particle types have different average sizes, their abundance is represented by their area fraction in Fig. 9C. Starch and smaller oligo- and polysaccharides, which are the main components of flour, account for two thirds of the mixture. Sugar and vanilla sugar represent about 15% and baking powder 5%. The remaining 5% include, for example, some proteins. More detailed analyses of the particles' shapes and sizes would of course be possible after measuring a more statistically significant number of particles. Further examples for particle characterization with ParticleScout and Raman microscopy can be found in the WITec Application Note about particle analysis [10].
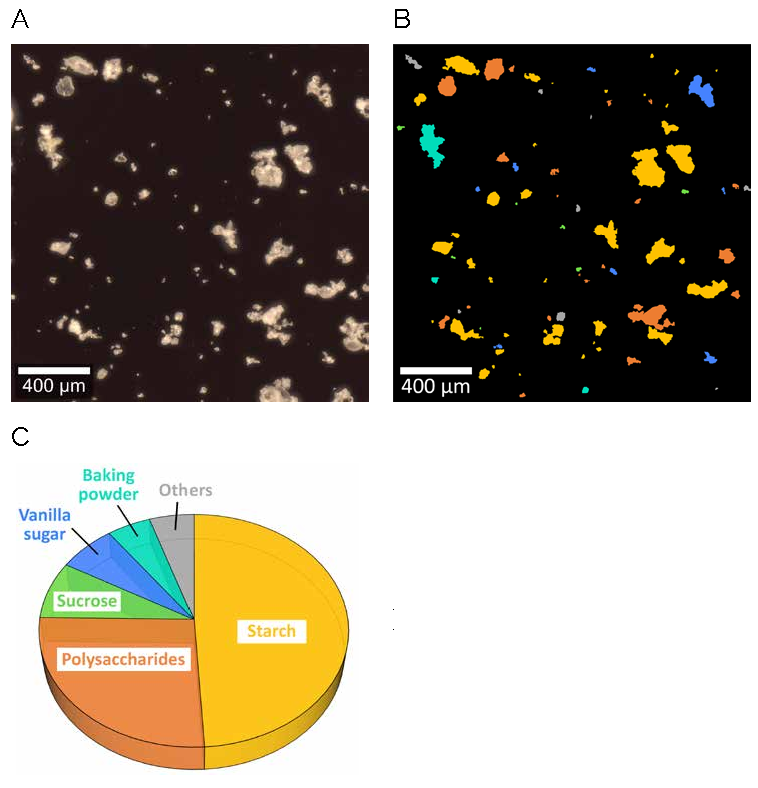
Fig. 9 — Particle analysis with Raman spectroscopy in a mixture of baking ingredients. (A) Dark-field image of the particles in a mixture of typical baking ingredients. (B) The particles located in A were color-coded according to their Raman spectra: starch (yellow), polysaccharides (orange), sucrose (green), vanilla sugar (blue), baking powder (cyan), others (grey). Particles at the picture edges were not analyzed. (C) The components' area fractions. In total, 139 particles were identified.

© Oxford Instruments 2026